Growing Together: How Greenspace Relates to Health
Tree Data Cleaning
trees_2015 =
  read_csv("large_tree_data/2015_tree_raw.csv", na = c("", "NA", "Unknown")) |>
  janitor::clean_names() |>
  mutate(spc_common = str_to_title(spc_common)) |>
  mutate(health = fct_relevel(health, c("Good", "Fair", "Poor")))
Asthma
Since NTAs may differ in size, trees per acre was used to standardize street tree counts in each NTA by the acreage of the NTA. 6 NTAs from the 2015 Tree Census were missing acreage information, so these NTAs were removed for these analyses.
Only alive trees were included in the asthma related analyses.
Correlation coefficients were calculated to gauge if a linear association exists between our x and y variables. To test the significance of a correlation coefficient, x and y variables must have a bivariate normal distribution. Since most of our x and y variables exhibited a skewed distribution (histograms not shown), we were unable to test the significance of the correlation coefficient at this time.
Asthma Emergency Department Visits
Is there an association between the number of trees per acre and the annual rate of adult asthma emergency department visits 1) across neighborhoods in NYC and 2) across neighborhoods in each borough?
All of NYC Combined
When examining all of the neighborhoods in NYC, there is a very weak, negative, linear association between number of trees per acre and the average annual rate of adult asthma emergency department visits per 10,000 people (r = - 0.0324).
acres_raw <-
  read_excel("small_data/t_pl_p5_nta.xlsx",
             range = "A9:J203",
             col_names = c("borough", "county_code", "nta", "nta_name",
                           "total_pop_2000", "total_pop_2010", "pop_change_num",
                           "pop_change_per", "total_acres", "persons_per_acre")
             ) |>
  janitor::clean_names()

acres_sub <- acres_raw |>
  select(nta_name, total_acres, nta)

trees_per_nta <- trees_2015 |>
  select(nta_name, nta, borough, status) |>
  filter(status == "Alive") |>
  count(nta_name, borough) |>
  rename(num_trees = n)

trees_and_acres <- left_join(trees_per_nta, acres_sub, by = "nta_name")

num_missing_nta <- sum(is.na(trees_and_acres$total_acres))

trees_per_acre_df <- trees_and_acres |>
  filter(!is.na(total_acres)) |>
  mutate(trees_per_acre = num_trees/total_acres) |>
  arrange(desc(trees_per_acre))

asthma_ed_adults_raw =
  read_csv("small_data/NYC EH Data Portal_Asthma emergency department visits adults.csv") |>
  janitor::clean_names()

asthma_ed_adults_clean = asthma_ed_adults_raw |>
  rename(nta_name = geography) |>
  filter(geo_type == "NTA2010" & time == "2017-2019") |>
  select(nta_name, average_annual_age_adjusted_rate_per_10_000, average_annual_rate_per_10_000)

trees_and_asthma_ed_adult <- left_join(trees_per_acre_df, asthma_ed_adults_clean, by = "nta_name")

cor(pull(trees_and_asthma_ed_adult, trees_per_acre), pull(trees_and_asthma_ed_adult, average_annual_rate_per_10_000))
## [1] -0.03239992trees_and_asthma_ed_adult |>
plot_ly(data = _, x = ~trees_per_acre, y = ~average_annual_rate_per_10_000,
color = ~nta_name,
colors = "viridis",
type = "scatter",
mode = "markers",
text = ~paste("neighborhood: ", nta_name, "<br>borough: ", borough,
"<br>tree per acre: ", trees_per_acre, "<br>rate of adult asthma ED visits: ",
average_annual_rate_per_10_000)) |>
layout(title = "Trees per acre and rate of adult asthma ED visits in NYC",
xaxis = list(title = 'Number of trees per acre'),
yaxis = list(title = 'Average annual rate of <br> adult asthma emergency dept visits (per 10,000)'),
legend = list(title=list(text='Neighborhood')))Asthma Emergency Department Visits By Borough
The following tabs explore the association between number of trees per acre and the average annual rate of adult asthma emergency department visits per 10,000 people.
Manhattan
When examining only neighborhoods in Manhattan, there remains a very weak, negative, linear association between number of trees per acre and the average annual rate of adult asthma emergency department visits per 10,000 people (r = - 0.0168). This could indicate that a non-linear relationship may be more suitable; it is also possible that no association exists.
manhattan_per_acre_asthma_ed_adult <- trees_and_asthma_ed_adult |>
  filter(borough == "Manhattan")

cor(pull(manhattan_per_acre_asthma_ed_adult, trees_per_acre), pull(manhattan_per_acre_asthma_ed_adult, average_annual_rate_per_10_000))
## [1] -0.01677473trees_and_asthma_ed_adult |>
filter(borough == "Manhattan") |>
plot_ly(data = _, x = ~trees_per_acre, y = ~average_annual_rate_per_10_000,
color = ~nta_name,
colors = "viridis",
type = "scatter",
mode = "markers",
text = ~paste("neighborhood: ", nta_name, "<br>borough: ", borough,
"<br>tree per acre: ", trees_per_acre, "<br>rate of adult asthma ED visits: ",
average_annual_rate_per_10_000)) |>
layout(title = "Trees per acre and rate of adult asthma ED visits in Manhattan",
xaxis = list(title = 'Number of trees per acre'),
yaxis = list(title = 'Average annual rate of <br> adult asthma emergency dept visits (per 10,000)'),
legend = list(title=list(text='Neighborhood')))The Bronx
When examining only neighborhoods in the Bronx, there is a moderate, positive, linear association between number of trees per acre and the average annual rate of adult asthma emergency department visits per 10,000 people (r = 0.4323). It appears that as the number of trees per acre increases, the rate of adult asthma emergency department visits increases. These results are contrary to our expectations. This may indicate that other factors may contribute to adult asthma emergency department visits; for instance, trees per acre may serve as a proxy for a different variable driving the association with asthma ED visits.
bronx_per_acre_asthma_ed_adult <- trees_and_asthma_ed_adult |>
  filter(borough == "Bronx")

cor(pull(bronx_per_acre_asthma_ed_adult, trees_per_acre), pull(bronx_per_acre_asthma_ed_adult, average_annual_rate_per_10_000))
## [1] 0.432286trees_and_asthma_ed_adult |>
filter(borough == "Bronx") |>
plot_ly(data = _, x = ~trees_per_acre, y = ~average_annual_rate_per_10_000,
color = ~nta_name,
colors = "viridis",
type = "scatter",
mode = "markers",
text = ~paste("neighborhood: ", nta_name, "<br>borough: ", borough,
"<br>tree per acre: ", trees_per_acre, "<br>rate of adult asthma ED visits: ",
average_annual_rate_per_10_000)) |>
layout(title = "Trees per acre and rate of adult asthma ED visits in Bronx",
xaxis = list(title = 'Number of trees per acre'),
yaxis = list(title = 'Average annual rate of <br> adult asthma emergency dept visits (per 10,000)'),
legend = list(title=list(text='Neighborhood')))Brooklyn
When examining only neighborhoods in Brooklyn, there remains a very weak, negative, linear association between number of trees per acre and the average annual rate of adult asthma emergency department visits per 10,000 people (r = - 0.0532). This could indicate that a non-linear relationship may be more suitable; it is also possible that no association exists.
brooklyn_per_acre_asthma_ed_adult <- trees_and_asthma_ed_adult |>
  filter(borough == "Brooklyn")

cor(pull(brooklyn_per_acre_asthma_ed_adult, trees_per_acre), pull(brooklyn_per_acre_asthma_ed_adult, average_annual_rate_per_10_000))
## [1] -0.05317623trees_and_asthma_ed_adult |>
filter(borough == "Brooklyn") |>
plot_ly(data = _, x = ~trees_per_acre, y = ~average_annual_rate_per_10_000,
color = ~nta_name,
colors = "viridis",
type = "scatter",
mode = "markers",
text = ~paste("neighborhood: ", nta_name, "<br>borough: ", borough,
"<br>tree per acre: ", trees_per_acre, "<br>rate of adult asthma ED visits: ",
average_annual_rate_per_10_000)) |>
layout(title = "Trees per acre and rate of adult asthma ED visits in Brooklyn",
xaxis = list(title = 'Number of trees per acre'),
yaxis = list(title = 'Average annual rate of <br> adult asthma emergency dept visits (per 10,000)'),
legend = list(title=list(text='Neighborhood')))Staten Island
When examining only neighborhoods in Staten Island, there is a moderate, negative, linear association between number of trees per acre and the average annual rate of adult asthma emergency department visits per 10,000 people (r = -0.4554). As the number of trees per acre increases, the rate of adult asthma emergency department visits decreases.
staten_island_per_acre_asthma_ed_adult <- trees_and_asthma_ed_adult |>
  filter(borough == "Staten Island")

cor(pull(staten_island_per_acre_asthma_ed_adult, trees_per_acre), pull(staten_island_per_acre_asthma_ed_adult, average_annual_rate_per_10_000))
## [1] -0.4554412trees_and_asthma_ed_adult |>
filter(borough == "Staten Island") |>
plot_ly(data = _, x = ~trees_per_acre, y = ~average_annual_rate_per_10_000,
color = ~nta_name,
colors = "viridis",
type = "scatter",
mode = "markers",
text = ~paste("neighborhood: ", nta_name, "<br>borough: ", borough,
"<br>tree per acre: ", trees_per_acre, "<br>rate of adult asthma ED visits: ",
average_annual_rate_per_10_000)) |>
layout(title = "Trees per acre and rate of adult asthma ED visits in Staten Island",
xaxis = list(title = 'Number of trees per acre'),
yaxis = list(title = 'Average annual rate of <br> adult asthma emergency dept visits (per 10,000)'),
legend = list(title=list(text='Neighborhood')))Queens
When examining only neighborhoods in Queens, there is a moderate, negative, linear association between number of trees per acre and the average annual rate of adult asthma emergency department visits per 10,000 people (r = -0.5260). As the number of trees per acre increases, the rate of adult asthma emergency department visits decreases.
queens_per_acre_asthma_ed_adult <- trees_and_asthma_ed_adult |>
  filter(borough == "Queens")

cor(pull(queens_per_acre_asthma_ed_adult, trees_per_acre), pull(queens_per_acre_asthma_ed_adult, average_annual_rate_per_10_000))
## [1] -0.5259892trees_and_asthma_ed_adult |>
filter(borough == "Queens") |>
plot_ly(data = _, x = ~trees_per_acre, y = ~average_annual_rate_per_10_000,
color = ~nta_name,
colors = "viridis",
type = "scatter",
mode = "markers",
text = ~paste("neighborhood: ", nta_name, "<br>borough: ", borough,
"<br>tree per acre: ", trees_per_acre, "<br>rate of adult asthma ED visits: ",
average_annual_rate_per_10_000)) |>
layout(title = "Trees per acre and rate of adult asthma ED visits in Queens",
xaxis = list(title = 'Number of trees per acre'),
yaxis = list(title = 'Average annual rate of <br> adult asthma emergency dept visits (per 10,000)'),
legend = list(title=list(text='Neighborhood')))Summary
Summary: When examining all of the neighborhoods in NYC, there is a very weak, negative, linear association between number of trees per acre and the average annual rate of adult asthma emergency department visits per 10,000 people. When examining neighborhoods by borough, the association between number of trees per acre and adult asthma emergency department visits per 10,000 people varies. Notably, neighborhoods across Staten Island and Queens exhibit a moderate, negative, linear association between number of trees per acre and the average annual rate of adult asthma emergency department visits per 10,000 people. As the number of trees per acre increases, the rate of adult asthma emergency department visits decreases.
Asthma Hospitalizations
Is there an association between the number of trees per acre and the annual rate of adult asthma hospitalizations 1) across neighborhoods in NYC and 2) across neighborhoods in each borough?
All of NYC Combined
When examining all of the neighborhoods in NYC, there is a weak, negative, linear association between number of trees per acre and the average annual rate of adult asthma hospitalizations per 10,000 people (r = - 0.1008).
asthma_hosp_adult_raw <-
  read_csv("small_data/NYC EH Data Portal - Asthma hospitalizations adults.csv") |>
  janitor::clean_names()

asthma_hosp_adult_clean <- asthma_hosp_adult_raw |>
  rename(nta_name = geography) |>
  filter(geo_type == "NTA2010" & time == "2012-2014") |>
  select(nta_name, average_annual_age_adjusted_rate_per_10_000, average_annual_rate_per_10_000)

trees_and_asthma_hosp_adult <- left_join(trees_per_acre_df, asthma_hosp_adult_clean, by = "nta_name")

cor(pull(trees_and_asthma_hosp_adult, trees_per_acre), pull(trees_and_asthma_hosp_adult, average_annual_rate_per_10_000))
## [1] -0.1008403trees_and_asthma_hosp_adult |>
plot_ly(data = _, x = ~trees_per_acre, y = ~average_annual_rate_per_10_000,
color = ~nta_name,
colors = "viridis",
type = "scatter",
mode = "markers",
text = ~paste("neighborhood: ", nta_name, "<br>borough: ", borough,
"<br>tree per acre: ", trees_per_acre,
"<br>rate of adult asthma hospitalizations: ", average_annual_rate_per_10_000)) |>
layout(title = "Trees per acre and rate of adult asthma hospitalizations in NYC",
xaxis = list(title = 'Number of trees per acre'),
yaxis = list(title = 'Average annual rate of <br> adult asthma hospitalizations (per 10,000)'),
legend = list(title=list(text='Neighborhood')))Asthma Hospitalizations By Borough
The following tabs explore the association between number of trees per acre and the average annual rate of adult asthma hospitalizations per 10,000 people.
Manhattan
When examining only neighborhoods in Manhattan, there is a very weak, negative, linear association between number of trees per acre and the average annual rate of adult asthma hospitalizations per 10,000 people (r = - 0.0619). This could indicate that a non-linear relationship may be more suitable; it is also possible that no association exists.
manhattan_trees_and_asthma_hosp_adult <- trees_and_asthma_hosp_adult |>
  filter(borough == "Manhattan")

cor(pull(manhattan_trees_and_asthma_hosp_adult, trees_per_acre), pull(manhattan_trees_and_asthma_hosp_adult, average_annual_rate_per_10_000))
## [1] -0.0618859trees_and_asthma_hosp_adult |>
filter(borough == "Manhattan") |>
plot_ly(data = _, x = ~trees_per_acre, y = ~average_annual_rate_per_10_000,
color = ~nta_name,
colors = "viridis",
type = "scatter",
mode = "markers",
text = ~paste("neighborhood: ", nta_name, "<br>borough: ", borough,
"<br>tree per acre: ", trees_per_acre,
"<br>rate of adult asthma hospitalizations: ", average_annual_rate_per_10_000)) |>
layout(title = "Trees per acre and rate of adult asthma hospitalizations in Manhattan",
xaxis = list(title = 'Number of trees per acre'),
yaxis = list(title = 'Average annual rate of <br> adult asthma hospitalizations (per 10,000)'),
legend = list(title=list(text='Neighborhood')))The Bronx
When examining only neighborhoods in the Bronx, there is a weak, positive, linear association between number of trees per acre and the average annual rate of adult asthma hospitalizations per 10,000 people (r = 0.3762). It appears that as the number of trees per acre increases, the rate of adult asthma hospitalizations increases. These results are contrary to our expectations. This may indicate that other factors may contribute to adult asthma hospitalizations; for instance, trees per acre may serve as a proxy for a different variable driving the association with asthma hospitalizations.
bronx_trees_and_asthma_hosp_adult <- trees_and_asthma_hosp_adult |>
  filter(borough == "Bronx")

cor(pull(bronx_trees_and_asthma_hosp_adult, trees_per_acre), pull(bronx_trees_and_asthma_hosp_adult, average_annual_rate_per_10_000))
## [1] 0.3762145trees_and_asthma_hosp_adult |>
filter(borough == "Bronx") |>
plot_ly(data = _, x = ~trees_per_acre, y = ~average_annual_rate_per_10_000,
color = ~nta_name,
colors = "viridis",
type = "scatter",
mode = "markers",
text = ~paste("neighborhood: ", nta_name, "<br>borough: ", borough,
"<br>tree per acre: ", trees_per_acre,
"<br>rate of adult asthma hospitalizations: ", average_annual_rate_per_10_000)) |>
layout(title = "Trees per acre and rate of adult asthma hospitalizations in Bronx",
xaxis = list(title = 'Number of trees per acre'),
yaxis = list(title = 'Average annual rate of <br> adult asthma hospitalizations (per 10,000)'),
legend = list(title=list(text='Neighborhood')))Brooklyn
When examining only neighborhoods in Brooklyn, there remains a weak, negative, linear association between number of trees per acre and the average annual rate of adult asthma hospitalizations per 10,000 people (r = - 0.1718).
brooklyn_trees_and_asthma_hosp_adult <- trees_and_asthma_hosp_adult |>
  filter(borough == "Brooklyn")

cor(pull(brooklyn_trees_and_asthma_hosp_adult, trees_per_acre), pull(brooklyn_trees_and_asthma_hosp_adult, average_annual_rate_per_10_000))
## [1] -0.1718282trees_and_asthma_hosp_adult |>
filter(borough == "Brooklyn") |>
plot_ly(data = _, x = ~trees_per_acre, y = ~average_annual_rate_per_10_000,
color = ~nta_name,
colors = "viridis",
type = "scatter",
mode = "markers",
text = ~paste("neighborhood: ", nta_name, "<br>borough: ", borough,
"<br>tree per acre: ", trees_per_acre,
"<br>rate of adult asthma hospitalizations: ", average_annual_rate_per_10_000)) |>
layout(title = "Trees per acre and rate of adult asthma hospitalizations in Brooklyn",
xaxis = list(title = 'Number of trees per acre'),
yaxis = list(title = 'Average annual rate of <br> adult asthma hospitalizations (per 10,000)'),
legend = list(title=list(text='Neighborhood')))Staten Island
When examining only neighborhoods in Staten Island, there is a moderate, negative, linear association between number of trees per acre and the average annual rate of adult asthma hospitalizations per 10,000 people (r = -0.4272). As the number of trees per acre increases, the rate of adult asthma hospitalizations decreases.
staten_island_trees_and_asthma_hosp_adult <- trees_and_asthma_hosp_adult |>
  filter(borough == "Staten Island")

cor(pull(staten_island_trees_and_asthma_hosp_adult, trees_per_acre), pull(staten_island_trees_and_asthma_hosp_adult, average_annual_rate_per_10_000))
## [1] -0.4272401trees_and_asthma_hosp_adult |>
filter(borough == "Staten Island") |>
plot_ly(data = _, x = ~trees_per_acre, y = ~average_annual_rate_per_10_000,
color = ~nta_name,
colors = "viridis",
type = "scatter",
mode = "markers",
text = ~paste("neighborhood: ", nta_name, "<br>borough: ", borough,
"<br>tree per acre: ", trees_per_acre,
"<br>rate of adult asthma hospitalizations: ", average_annual_rate_per_10_000)) |>
layout(title = "Trees per acre and rate of adult asthma hospitalizations in Staten Island",
xaxis = list(title = 'Number of trees per acre'),
yaxis = list(title = 'Average annual rate of <br> adult asthma hospitalizations (per 10,000)'),
legend = list(title=list(text='Neighborhood')))Queens
When examining only neighborhoods in Queens, there is a moderate, negative, linear association between number of trees per acre and the average annual rate of adult asthma hospitalizations per 10,000 people (r = -0.5502). As the number of trees per acre increases, the rate of adult asthma hospitalizations decreases.
queens_trees_and_asthma_hosp_adult <- trees_and_asthma_hosp_adult |>
  filter(borough == "Queens")

cor(pull(queens_trees_and_asthma_hosp_adult, trees_per_acre), pull(queens_trees_and_asthma_hosp_adult, average_annual_rate_per_10_000))
## [1] -0.5502027trees_and_asthma_hosp_adult |>
filter(borough == "Queens") |>
plot_ly(data = _, x = ~trees_per_acre, y = ~average_annual_rate_per_10_000,
color = ~nta_name,
colors = "viridis",
type = "scatter",
mode = "markers",
text = ~paste("neighborhood: ", nta_name, "<br>borough: ", borough,
"<br>tree per acre: ", trees_per_acre,
"<br>rate of adult asthma hospitalizations: ", average_annual_rate_per_10_000)) |>
layout(title = "Trees per acre and rate of adult asthma hospitalizations in Queens",
xaxis = list(title = 'Number of trees per acre'),
yaxis = list(title = 'Average annual rate of <br> adult asthma hospitalizations (per 10,000)'),
legend = list(title=list(text='Neighborhood')))Summary
Summary: When examining all of the neighborhoods in NYC, there is a weak, negative, linear association between number of trees per acre and the average annual rate of adult asthma hospitalizations per 10,000 people (r = - 0.1008). When examining neighborhoods by borough, the association between number of trees per acre and adult asthma hospitalizations per 10,000 people varies. Notably, neighborhoods across Staten Island and Queens exhibit a moderate, negative, linear association between number of trees per acre and the average annual rate of adult asthma hospitalizations per 10,000 people. As the number of trees per acre increases, the rate of adult asthma hospitalizations decreases.
Average Annual Hospitalization Rate Across NYC Neighborhoods
nyc_nta = st_read("small_data/geo_export_e924b274-8b6e-427d-87c0-92bfde8ce30a.shp",
                  quiet = TRUE)

nta_asthma_spatial = merge(nyc_nta, asthma_hosp_adult_clean,
                        by.x = "ntaname",
                        by.y = "nta_name")

tm_shape(nta_asthma_spatial) +
  tm_polygons(col = "average_annual_rate_per_10_000",
              style = "quantile",
              n = 5,
              palette = "Purples",
              border.col = "black",
              title = "Asthma Hospitalization Rate per 10k") +
  tm_layout(main.title = "Avg. Annual Hospitalization Rate Across NYC Neighborhoods", main.title.size = 1,
            frame = FALSE) +
  tm_legend(legend.position = c("left","center"),
            legend.text.size = 0.52)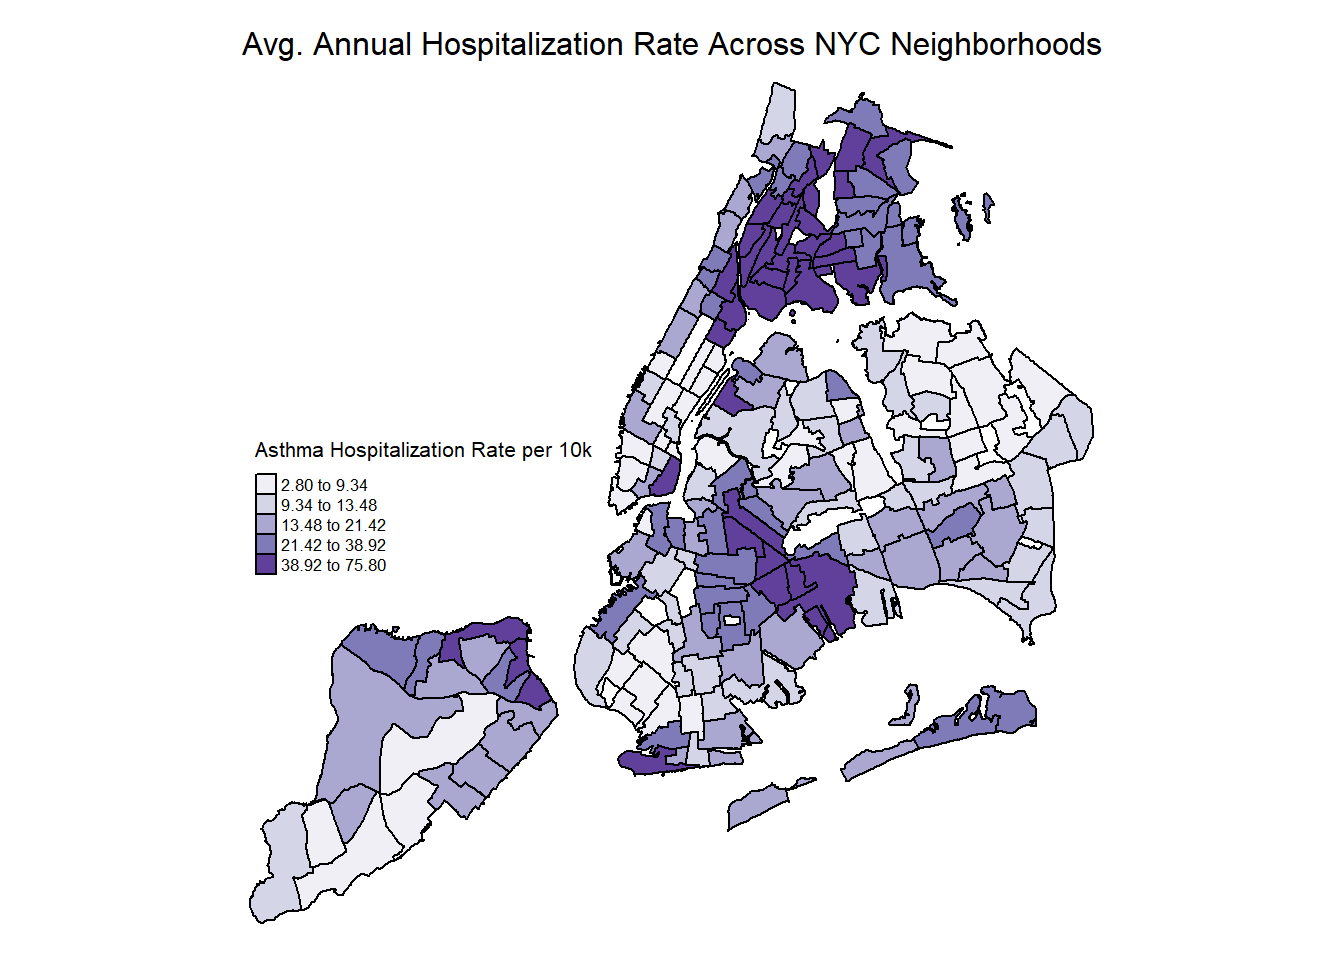
Comments:
- Largest concentration in Bronx and Brooklyn.
- South Manhattan has lowest hospitalization rates. - Income, socioeconomic mobility, and structural healthcare access appear to be playing major roles across neighborhoods.
Tree Count Per Acre Across NYC Neighborhoods
trees_nta_map = trees_2015|>
  select(nta_name, nta, borough, status) |>
  filter(status == "Alive") |>
  count(nta, borough) |>
  rename(num_trees = n)

trees_and_acres_map = left_join(trees_nta_map, acres_sub, by = "nta")
num_missing_nta = sum(is.na(trees_and_acres$total_acres))

trees_per_acre_mapdf = trees_and_acres_map |>
  filter(!is.na(total_acres)) |>
  mutate(trees_per_acre = num_trees/total_acres) |>
  arrange(desc(trees_per_acre))

tree_acre_spatial = merge(nyc_nta, trees_per_acre_mapdf,
                        by.x = "ntacode",
                        by.y = "nta")

tm_shape(tree_acre_spatial) +
  tm_polygons(col = "trees_per_acre",
              style = "quantile",
              n = 5,
              palette = "Greens",
              border.col = "black",
              title = "Avg. Trees Per Acre by NTA") +
  tm_layout(main.title = "Tree Count Per Acre Across NYC Neighborhoods", main.title.size = 1,
            frame = FALSE) +
  tm_legend(legend.position = c("left","center"),
            legend.text.size = 0.52)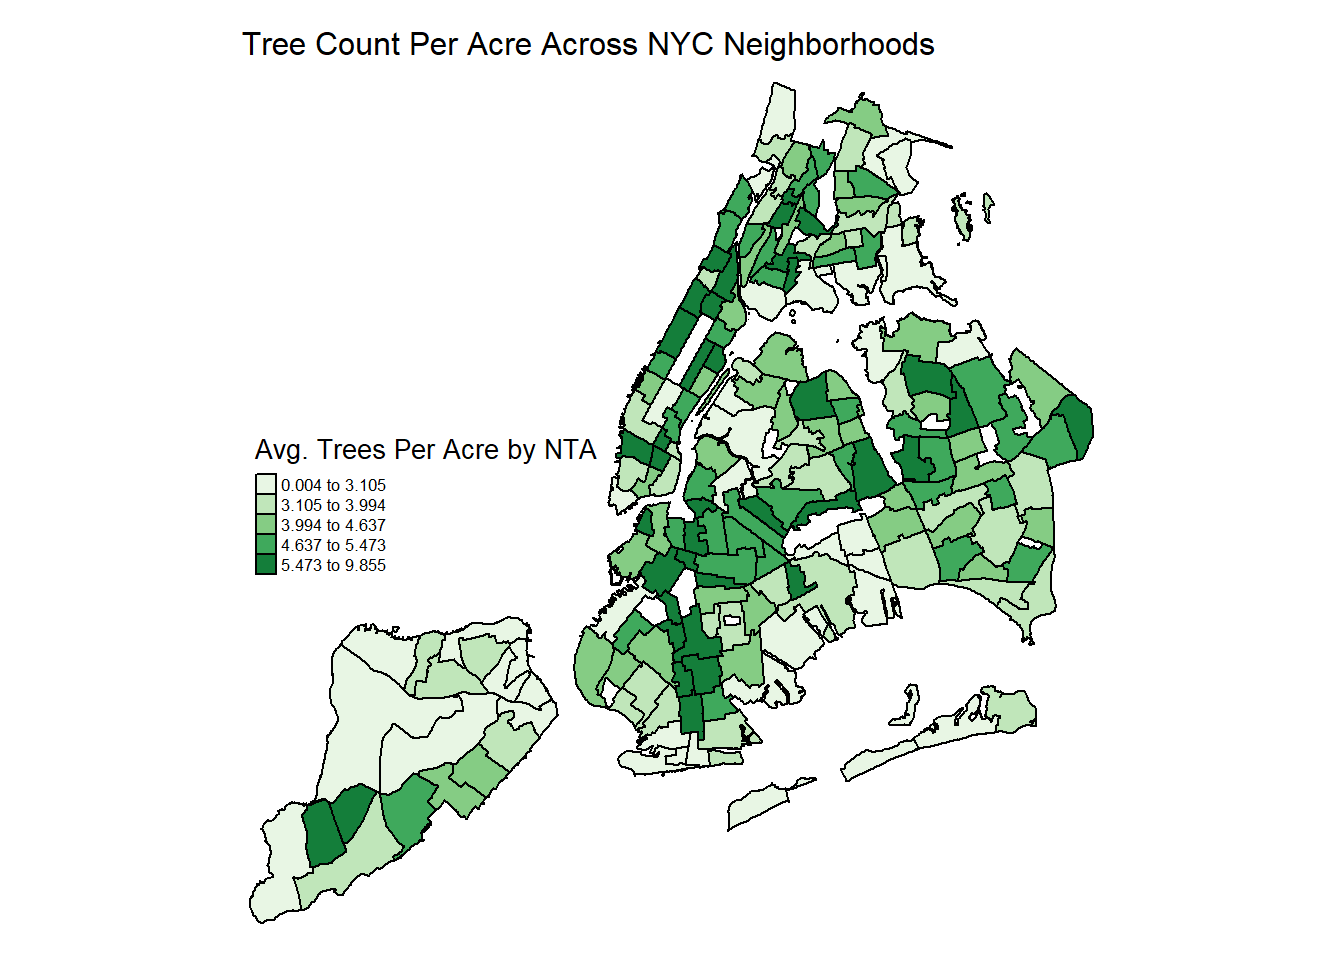
Comments:
- Upper West Side, Harlem, and certain Bronx neighborhoods do have greater tree density.
- This may be due to a greater distribution of younger trees in the same area.
- Larger neighborhood bands of urban street trees in Brooklyn and mid-Queens surrounding Flushing.
Particulate Matter
The EPA and Leading Forest Agencies discuss that one of the ecosystem benefits of urban street trees is the ability for trees to uptake fine particulate matter (PM2.5) from vehicle exhaust and local combustion through stomata uptake during photosynthesis.
nyc_comdist = st_read("small_data/geo_export_bd3c92bc-94de-48f3-9de3-e939473f307b.shp",
                      quiet = TRUE)

nyc_finepm2015 = read_csv("small_data/nyc_pm2.5_annual2015.csv") |>
  janitor::clean_names() |>
  filter(time == "Annual Average 2015" & geo_type_desc == "Community District") |>
  select(geo_id, geography, avg_pm2.5 = mean_mcg_m3)

trees_cd_summarized = trees_2015 |>
  drop_na(tree_dbh) |>
  mutate(health = as.factor(health)) |>
  group_by(community_board) |>
  summarize(
    "Number of Trees" = n(),
    avg_dbh = mean(tree_dbh),
    health_status = mode(health))

nyc_comdistrict_spatial = merge(nyc_comdist, trees_cd_summarized, nyc_finepm2015,
                        by.x = "boro_cd",
                        by.y = "community_board")

nyc_comdistrict_treesPM = merge(nyc_comdistrict_spatial, nyc_finepm2015,
                        by.x = "boro_cd",
                        by.y = "geo_id")

tm_shape(nyc_comdistrict_treesPM) +
  tm_polygons(col = "avg_pm2.5",
              style = "quantile",
              n = 5,
              palette = "YlOrBr",
              border.col = "black",
              title = "Average PM2.5 Concentration (µg/m3)") +
tm_shape(nyc_comdistrict_treesPM) +
  tm_dots(col = "black",
          size = "Number of Trees",
          style = "quantile",
          border.col = "black") +
  tm_layout(main.title = "Average 2015 PM2.5 Concentrations
            across NYC Community Districts", main.title.size = 1,
            frame = FALSE) +
  tm_legend(legend.position = c("left","top"),
            legend.text.size = 0.52)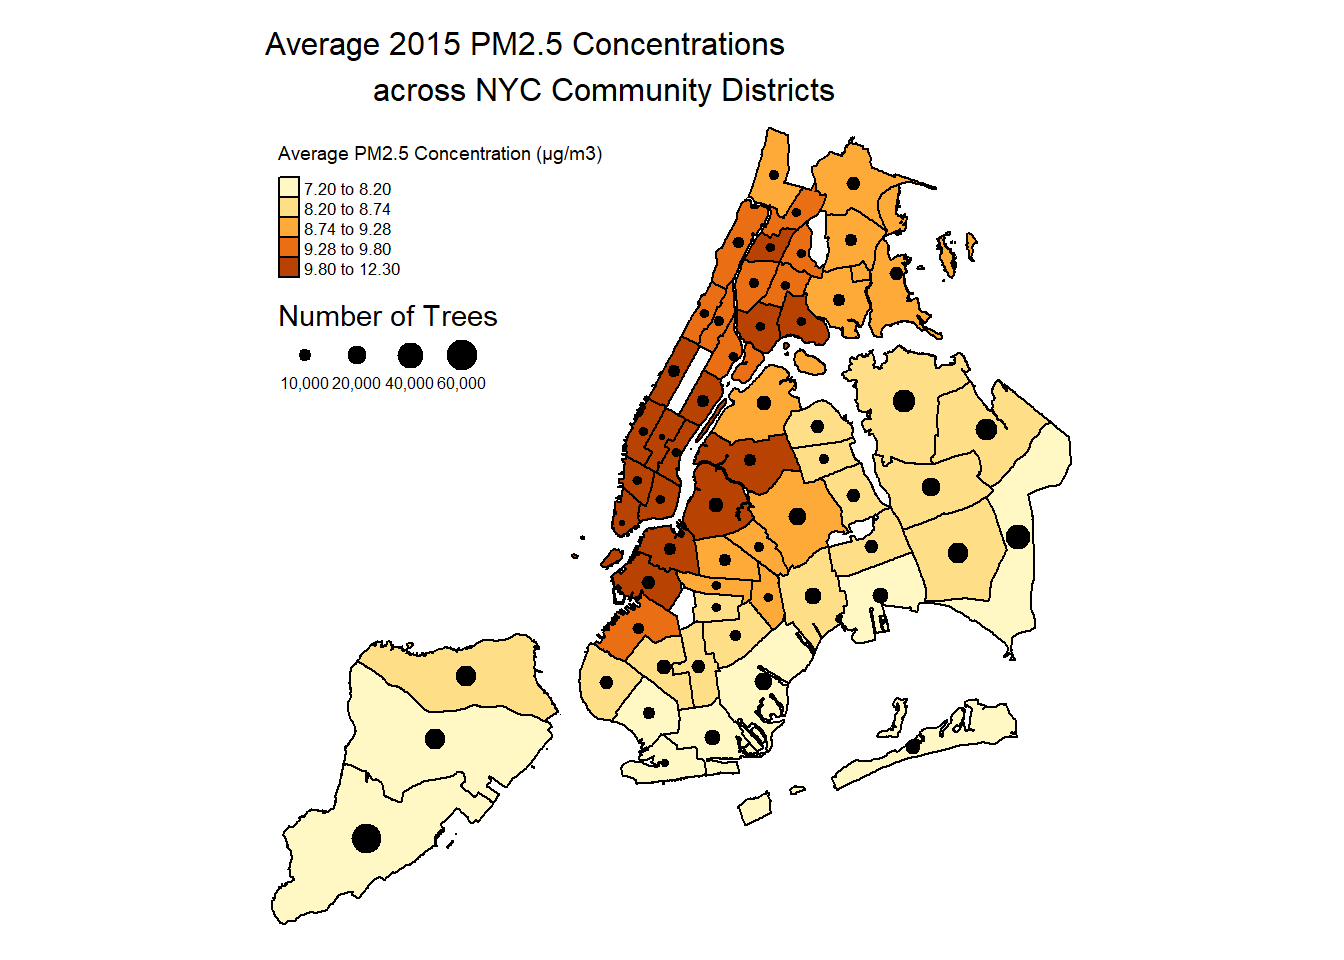
Comments:
- Highest chronic pollution across Manhattan and Upper Brooklyn neighborhoods - densest commercial zones. Particularly in Manhattan and the Bronx, this map suggests that the community districts with highest fine particulate exposures also have the lowest number of trees.
- Lowest ambient PM2.5 on the outermost edges of Brooklyn and Queens, also have high tree counts and highest dbh averages.
- Despite the highest pollution in these neighborhoods, asthma hospitalization still concentrates in the predominantly BIPOC communities of Central Bronx and Brooklyn.
Heatstress
nyc_heatstress_2015 = read_csv("small_data/nyc_Heatstress Hospitalizations_2011-2015.csv", na = c(" ", "NA", "***")) |>
  janitor::clean_names() |>
  filter(geo_type_desc == "Community District") |>
  mutate(
    average_annual_age_adjusted_rate_per_100_000 =
      str_replace(average_annual_age_adjusted_rate_per_100_000, "[*]$", "")) |>
  select(geo_id, avg_heat_hospit = average_annual_age_adjusted_rate_per_100_000, heat_hospitalizations = total) |>
  mutate(avg_heat_hospit = as.numeric(avg_heat_hospit))

nyc_comdistrict_heatstress = merge(nyc_comdistrict_treesPM, nyc_heatstress_2015,
                        by.x = "boro_cd",
                        by.y = "geo_id")

tm_shape(nyc_comdistrict_heatstress) +
  tm_polygons(col = "avg_heat_hospit",
              style = "jenks",
              n = 5,
              palette = "OrRd",
              border.col = "black",
              title = "Avg. Adjusted Hospitalization Rate per 100k") +
tm_shape(nyc_comdistrict_treesPM) +
  tm_dots(col = "black",
          size = "Number of Trees",
          style = "quantile",
          border.col = "black") +
  tm_layout(main.title = "Average Heatstress Hospitalization Rate
            across NYC Community Districts", main.title.size = 1,
            frame = FALSE) +
  tm_legend(legend.position = c("left","top"),
            legend.text.size = 0.52)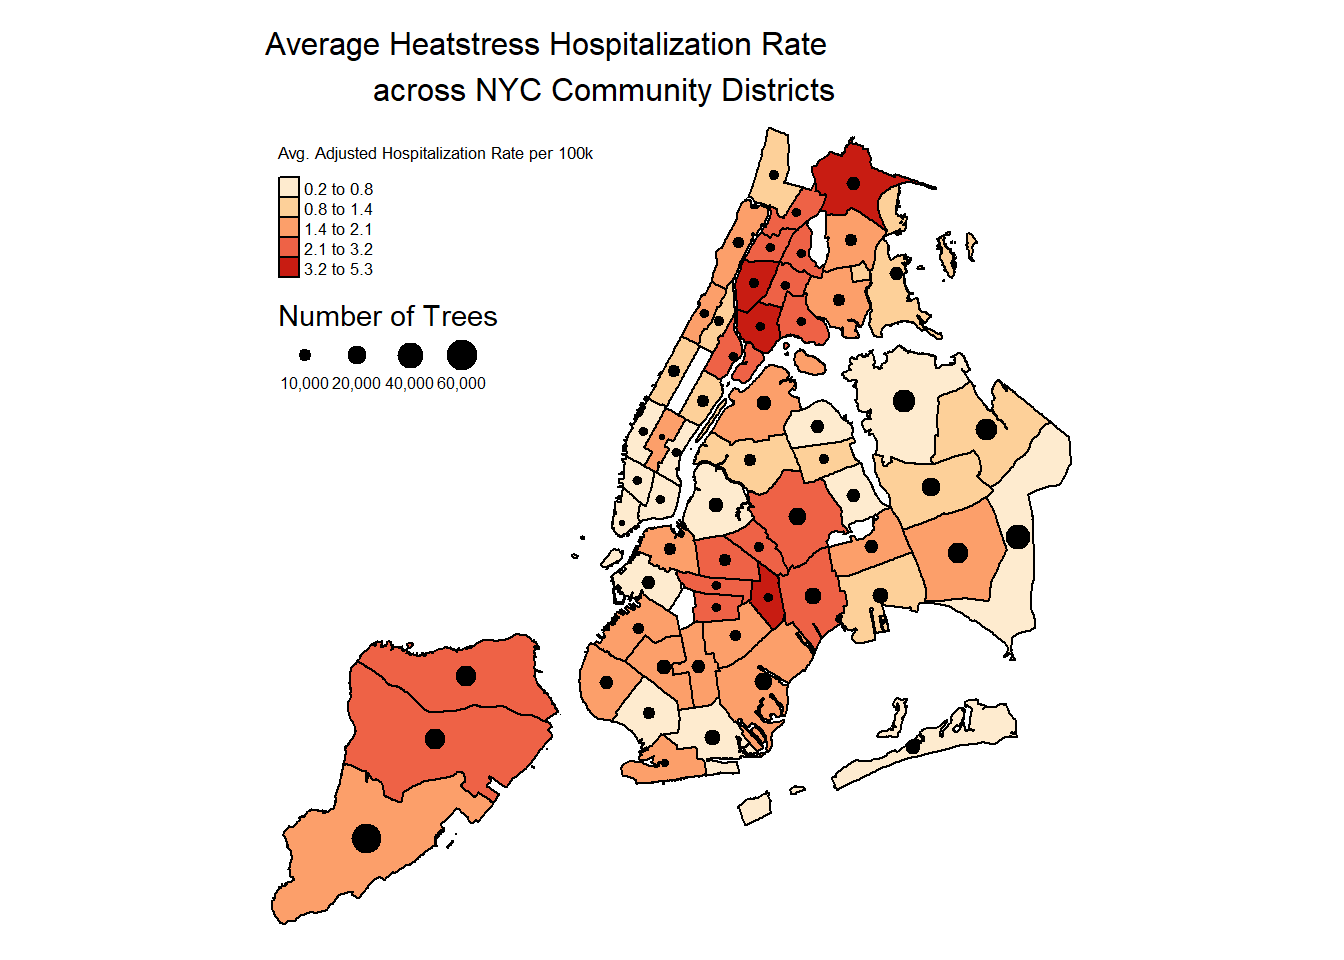
Comments:
- Largest cluster of heat stress hospitalizations is in the Bronx, as well as in Brooklyn.
- Covariates of structural racism and socioeconomic vulnerability of highest risk neighborhoods need to be further researched.
- The relationship between heatstess events and trees is a bit more variable. High count of trees in Queens community districts does align. But the low tree counts and low hospitalization in lower Manhattan may be due to other factors that induce urban heat and improved medical / healthcare access in that area.