Tree Attributes
knitr::opts_chunk$set(echo = TRUE, message = FALSE, warning = FALSE)

library(tidyverse)
library(rlang)
library(viridis)

theme_set(theme_minimal() + theme(legend.position = "right"))

options(
  ggplot2.continuous.colour = "viridis",
  ggplot2.continuous.fill = "viridis"
)

scale_colour_discrete = scale_colour_viridis_d
scale_fill_discrete = scale_fill_viridis_d
# Load and wrangle data
trees_2015 <- read_csv("large_tree_data/2015_tree_raw.csv", na = c("", "NA", "Unknown")) |>
janitor::clean_names() %>%
mutate(spc_common = str_to_title(spc_common)) %>%
mutate(health = fct_relevel(health, c("Good", "Fair", "Poor")))
tree_status_df <- trees_2015 %>%
select(curb_loc, guards, sidewalk, health, status,
borough,
root_stone, root_grate, root_other,
trunk_wire, trnk_light, trnk_other,
brch_light, brch_shoe, brch_other) %>%
mutate(health = fct_relevel(health, c("Good", "Fair", "Poor")),
borough = as.factor(borough),
All = as.factor("All"),
curb_loc = case_match(curb_loc,
"OffsetFromCurb" ~ "Offset From Curb",
"OnCurb" ~ "On Curb"),
curb_loc = as.factor(curb_loc),
guards = as.factor(guards),
sidewalk = case_match(sidewalk,
"NoDamage" ~ "No Damage",
"Damage" ~ "Damage"),
sidewalk = as.factor(sidewalk),
status = as.factor(status)
) %>%
rename(`Curb Location` = curb_loc,
`All of NYC` = All,
Borough = borough,
Guards = guards,
`Sidewalk Condition` = sidewalk,
`Alive, Dead, or Stump` = status,
Health = health,
`Roots with Stones` = root_stone,
`Roots in Grate` = root_grate,
`Root Problem (Other)` = root_other,
`Trunk has Wires` = trunk_wire,
`Trunk has Lights` = trnk_light,
`Trunk Problem (Other)` = trnk_other,
`Branches have Lights` = brch_light,
`Branches with Shoes` = brch_shoe,
`Branches Problem (Other)` = brch_other) %>%
select(Borough, `All of NYC`, everything())
exposure_options <- colnames(tree_status_df)[3:length(tree_status_df)]
outcome_options <- colnames(tree_status_df)[3:length(tree_status_df)]
# Define function for plot
tree_attribute_plot <- function(df, exposure_str, outcome_str){
# Convert character strings to symbols
exposure_sym <- rlang::sym(exposure_str)
outcome_sym <- rlang::sym(outcome_str)
# Make contingency table for the chi-square test
contingency_table <- df %>%
filter(!is.na(!!exposure_sym), !is.na(!!outcome_sym)) %>%
group_by(!!outcome_sym, !!exposure_sym) %>%
count(!!outcome_sym, !!exposure_sym) %>%
pivot_wider(names_from = !!exposure_sym, values_from = n)
# Perform the chi-square test
chisq_test_result <- chisq.test(contingency_table[-1])
chi_square <- chisq_test_result$statistic
p_value <- chisq_test_result$p.value
# Visualize the distribution differences
df %>%
filter(!is.na(!!exposure_sym), !is.na(!!outcome_sym)) %>%
group_by(!!exposure_sym, !!outcome_sym) %>%
summarize(n = n(), .groups = 'drop') %>%
group_by(!!exposure_sym) %>%
mutate(Percent = n / sum(n) * 100) %>%
ggplot(aes(x = !!exposure_sym, y = Percent, fill = !!outcome_sym)) +
geom_bar(stat = 'identity', position = 'dodge') +
geom_text(aes(label = sprintf("%.1f%%", Percent)),
position = position_dodge(width = 0.9),
size = 3.5,
vjust = -0.3) +
labs(title = str_c(outcome_str, " by ", exposure_str),
subtitle = sprintf("p value = %.1e (Chi-square = %.2f)", p_value, chi_square)) +
theme(legend.position="bottom") +
theme(text = element_text(size = 14))
}Tree Attributes in Different Scenarios
The section below allows for exploration of the relationship between different attributes of trees, such as curb location, tree guards, the quality of the sidewalk, or the tree health, with tree attributes, such as:
Health
Root health (whether they have stones, are in a grate, or have other problems)
Trunk health (whether it has wires, branches, or other abnormalities)
Branch details (lights or other abnormalities)
Whether the tree is alive, dead, or a stump.
The figure includes the percentages of the different distribution categories, a visualization of these relative percentages, and the results of a chi-square test to determine whether the distributions were significantly different between the conditions explored.
Curb Location
exposure <- "Curb Location"Tree Health
tree_attribute_plot(df = tree_status_df, exposure_str = exposure, outcome_str = "Health")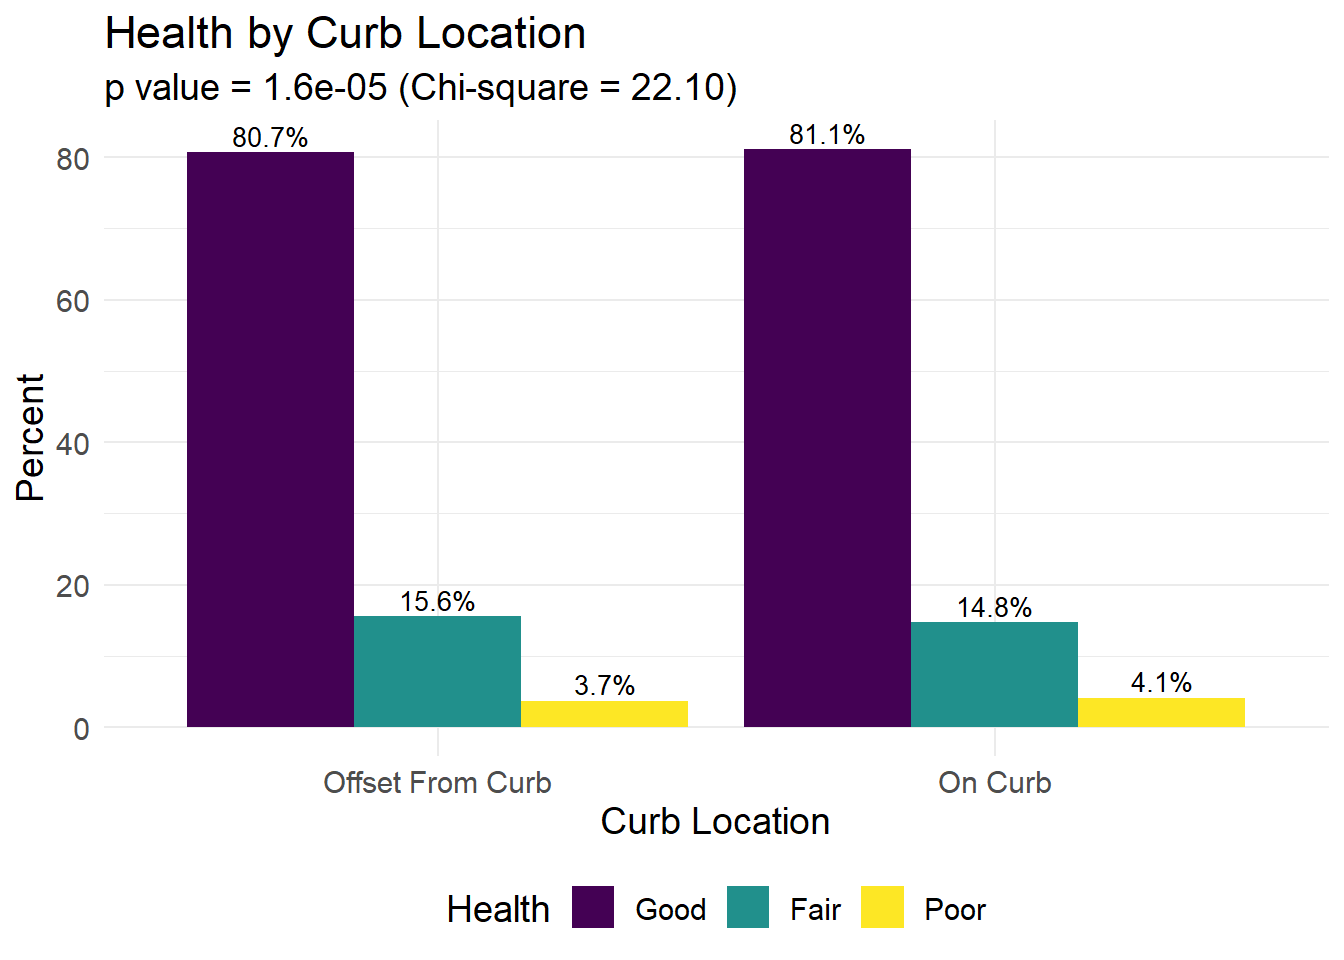
Roots
tree_attribute_plot(df = tree_status_df, exposure_str = exposure, outcome_str = "Roots with Stones")
tree_attribute_plot(df = tree_status_df, exposure_str = exposure, outcome_str = "Roots in Grate")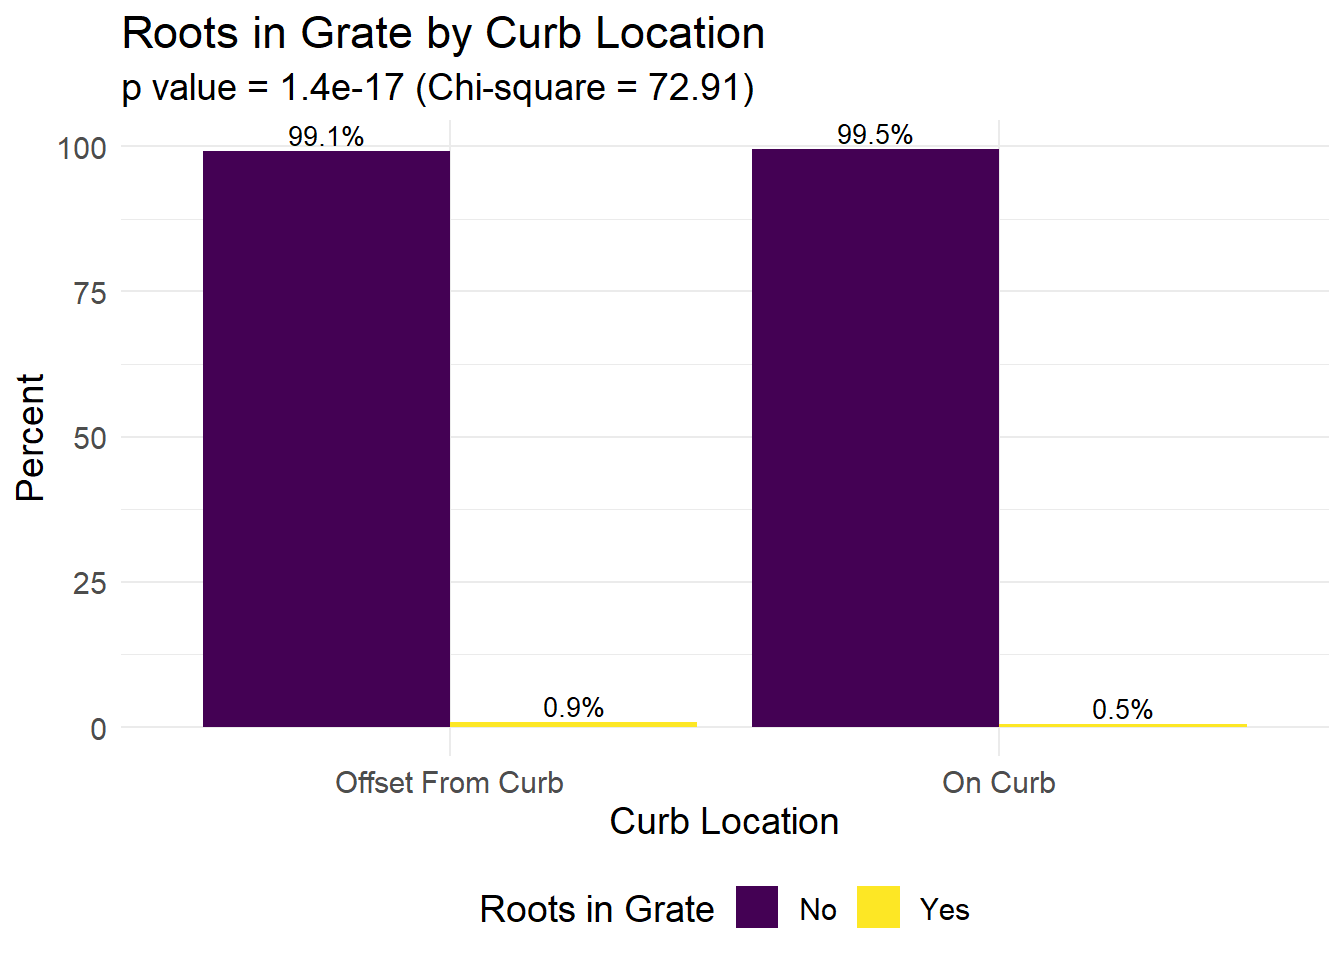
tree_attribute_plot(df = tree_status_df, exposure_str = exposure, outcome_str = "Root Problem (Other)")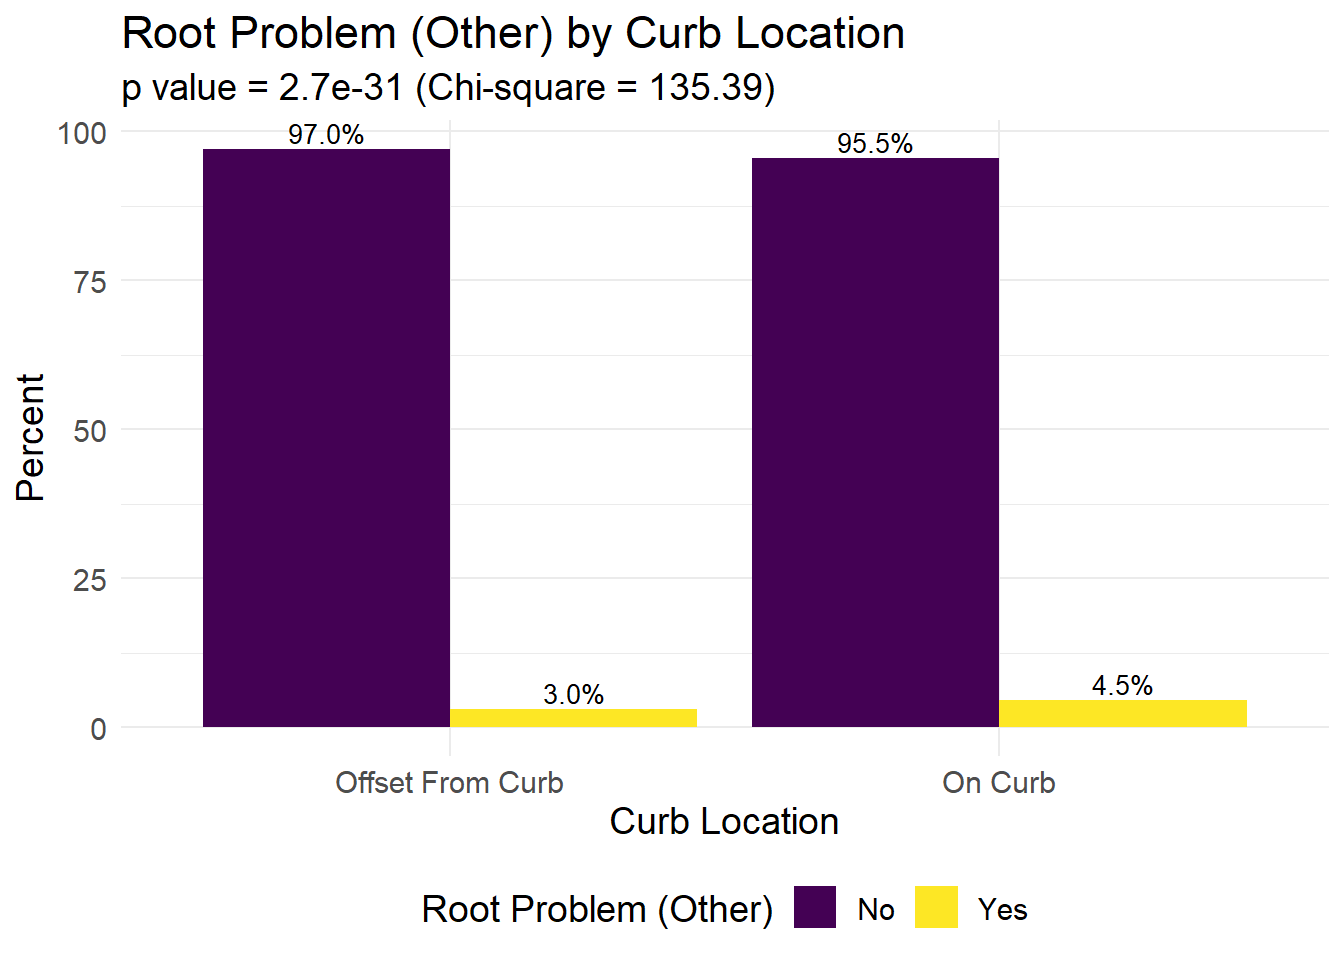
Trunk
tree_attribute_plot(df = tree_status_df, exposure_str = exposure, outcome_str = "Trunk has Wires")
tree_attribute_plot(df = tree_status_df, exposure_str = exposure, outcome_str = "Trunk has Lights")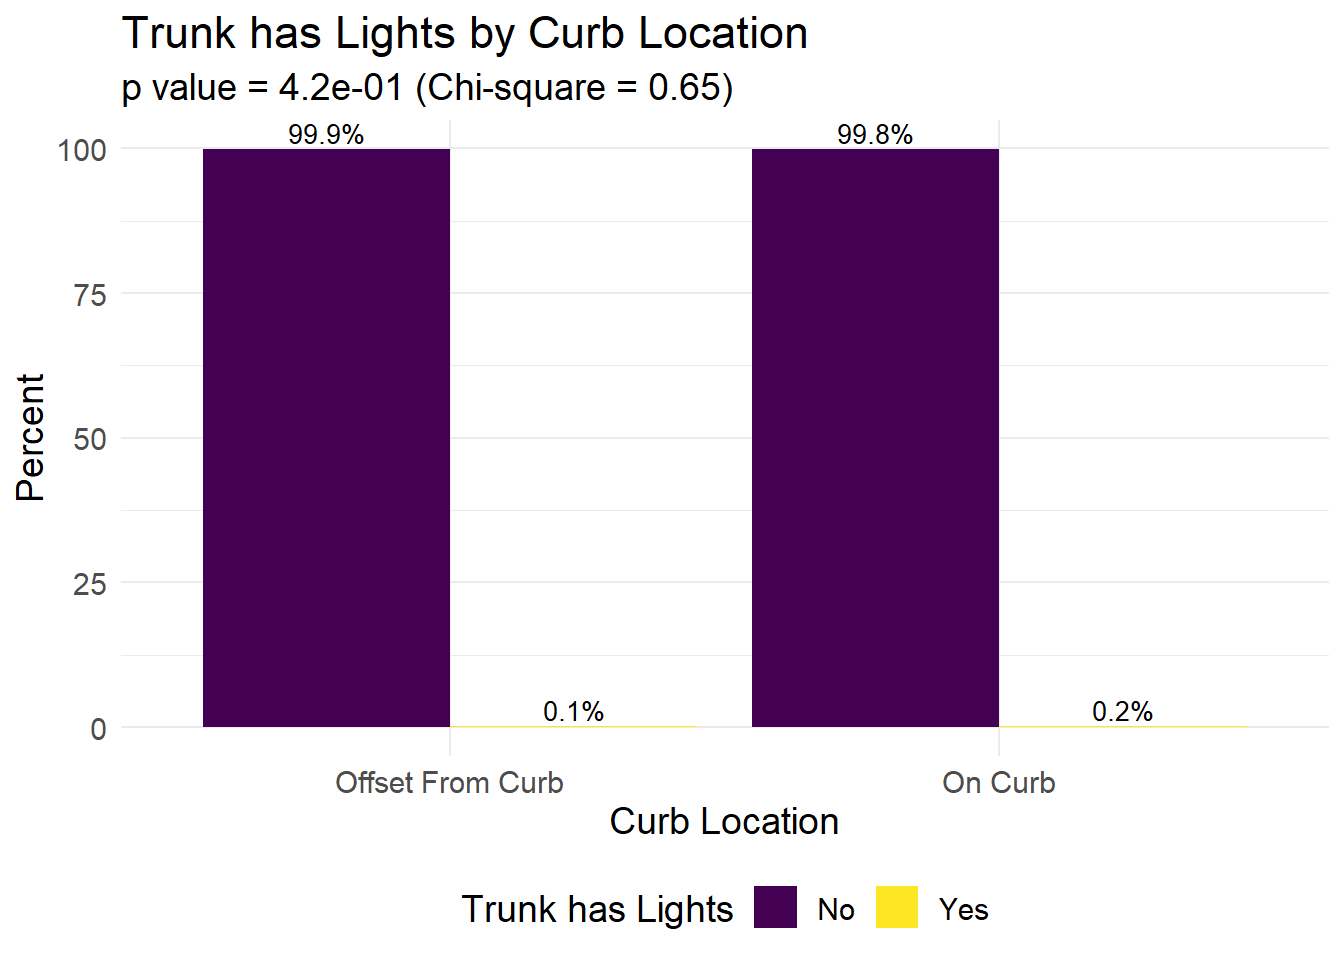
tree_attribute_plot(df = tree_status_df, exposure_str = exposure, outcome_str = "Trunk Problem (Other)")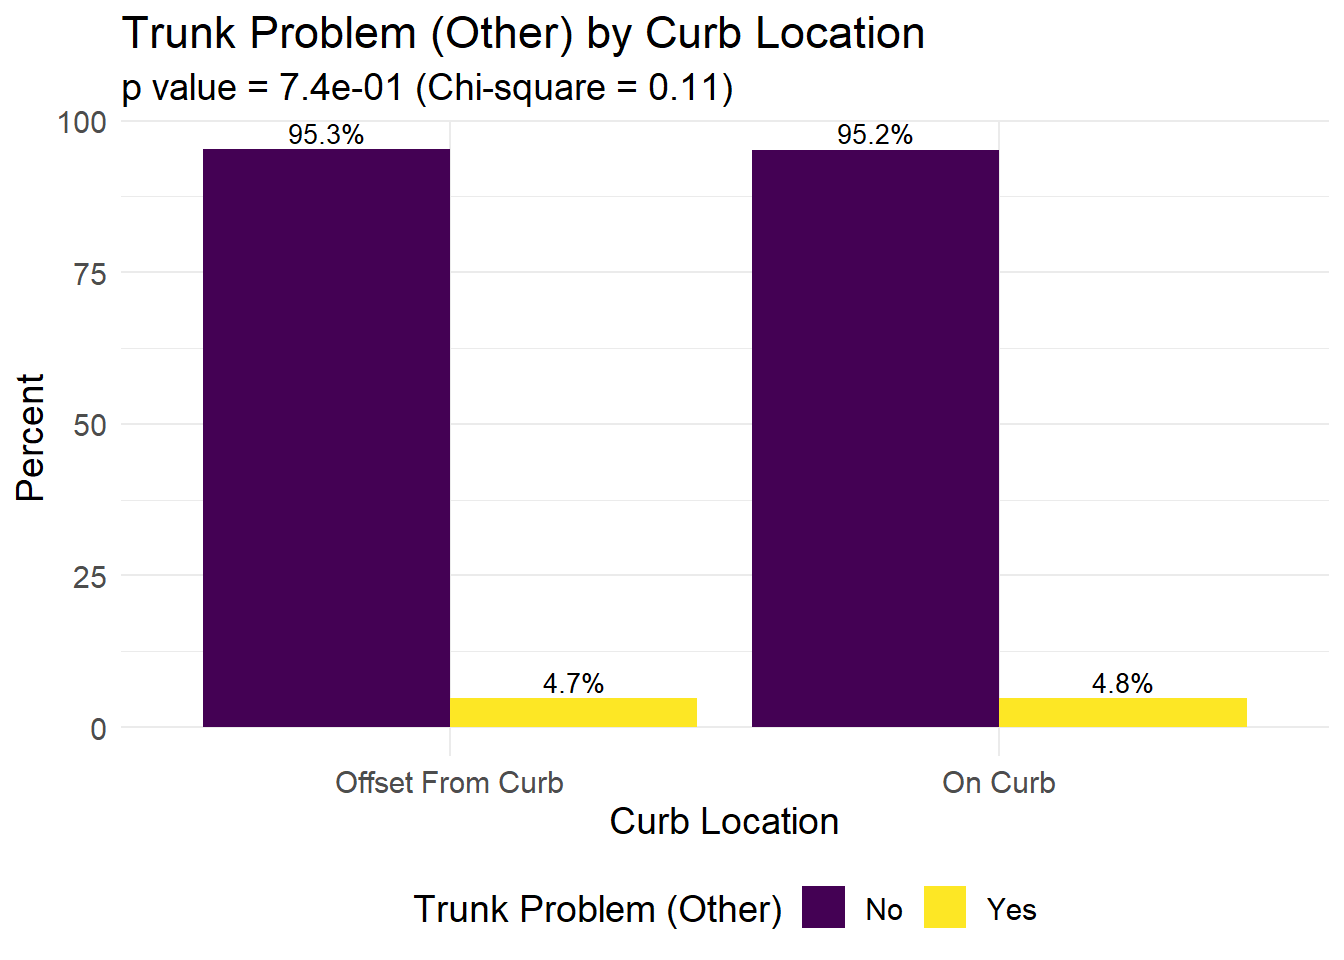
Branches
tree_attribute_plot(df = tree_status_df, exposure_str = exposure, outcome_str = "Branches have Lights")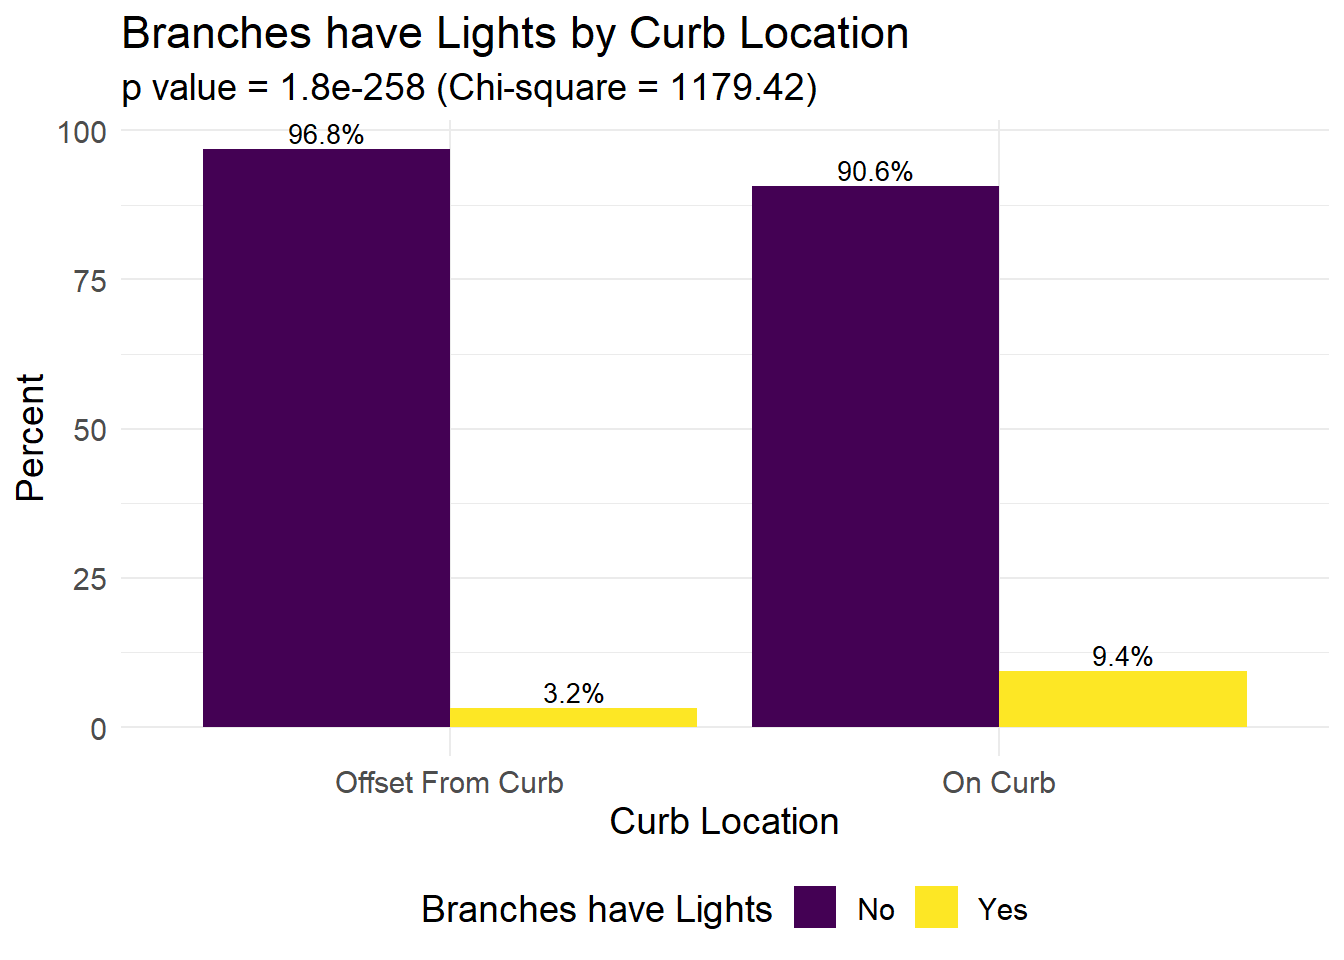
tree_attribute_plot(df = tree_status_df, exposure_str = exposure, outcome_str = "Branches Problem (Other)")
Vital Status
tree_attribute_plot(df = tree_status_df, exposure_str = exposure, outcome_str = "Alive, Dead, or Stump")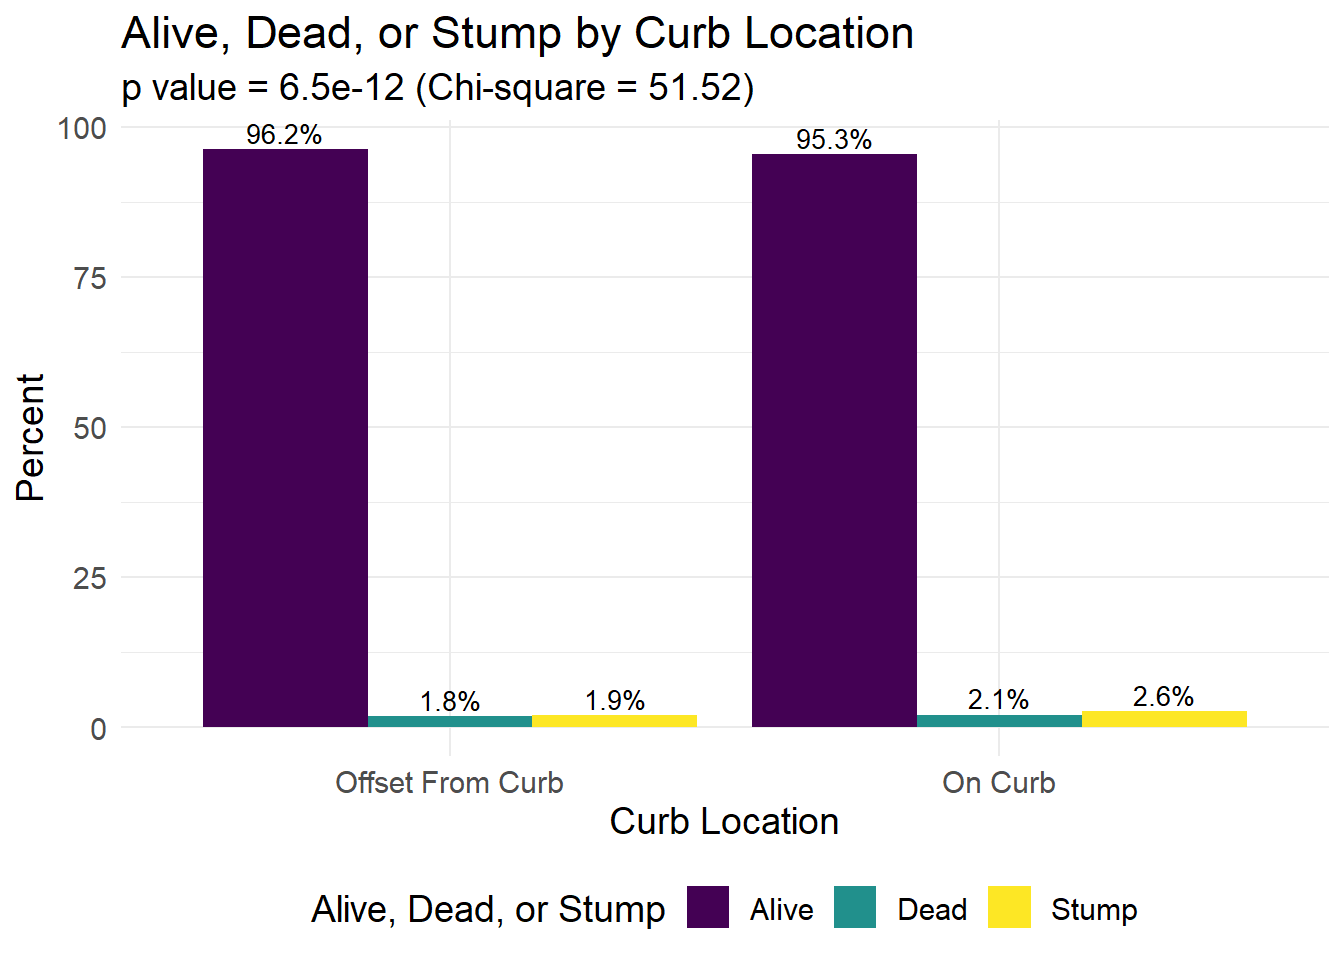
Sidewalk Condition
exposure <- "Sidewalk Condition"Tree Health
tree_attribute_plot(df = tree_status_df, exposure_str = exposure, outcome_str = "Health")
Roots
tree_attribute_plot(df = tree_status_df, exposure_str = exposure, outcome_str = "Roots with Stones")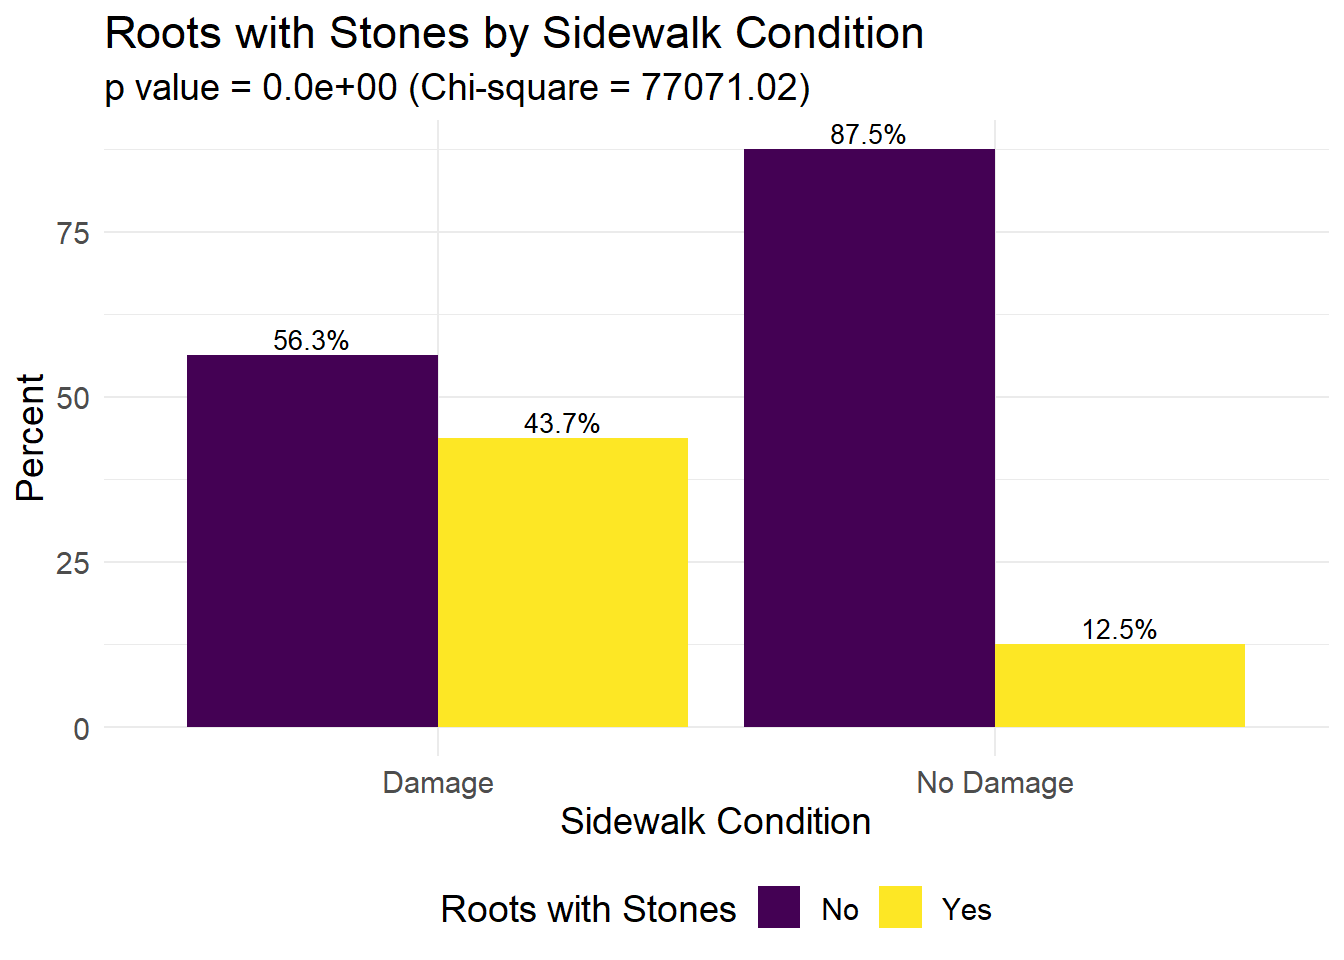
tree_attribute_plot(df = tree_status_df, exposure_str = exposure, outcome_str = "Roots in Grate")
tree_attribute_plot(df = tree_status_df, exposure_str = exposure, outcome_str = "Root Problem (Other)")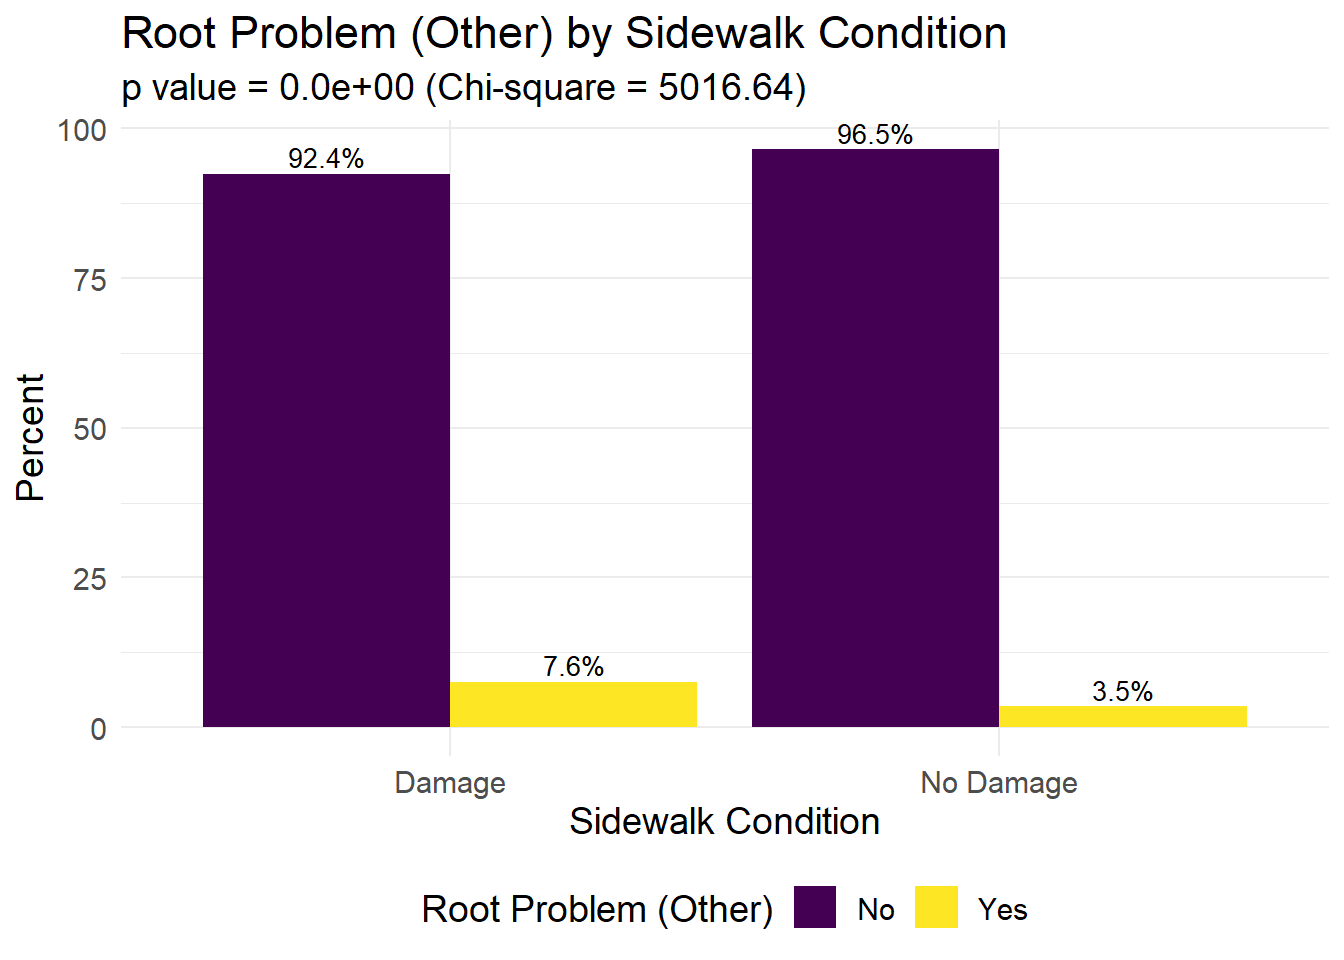
Trunk
tree_attribute_plot(df = tree_status_df, exposure_str = exposure, outcome_str = "Trunk has Wires")
tree_attribute_plot(df = tree_status_df, exposure_str = exposure, outcome_str = "Trunk has Lights")
tree_attribute_plot(df = tree_status_df, exposure_str = exposure, outcome_str = "Trunk Problem (Other)")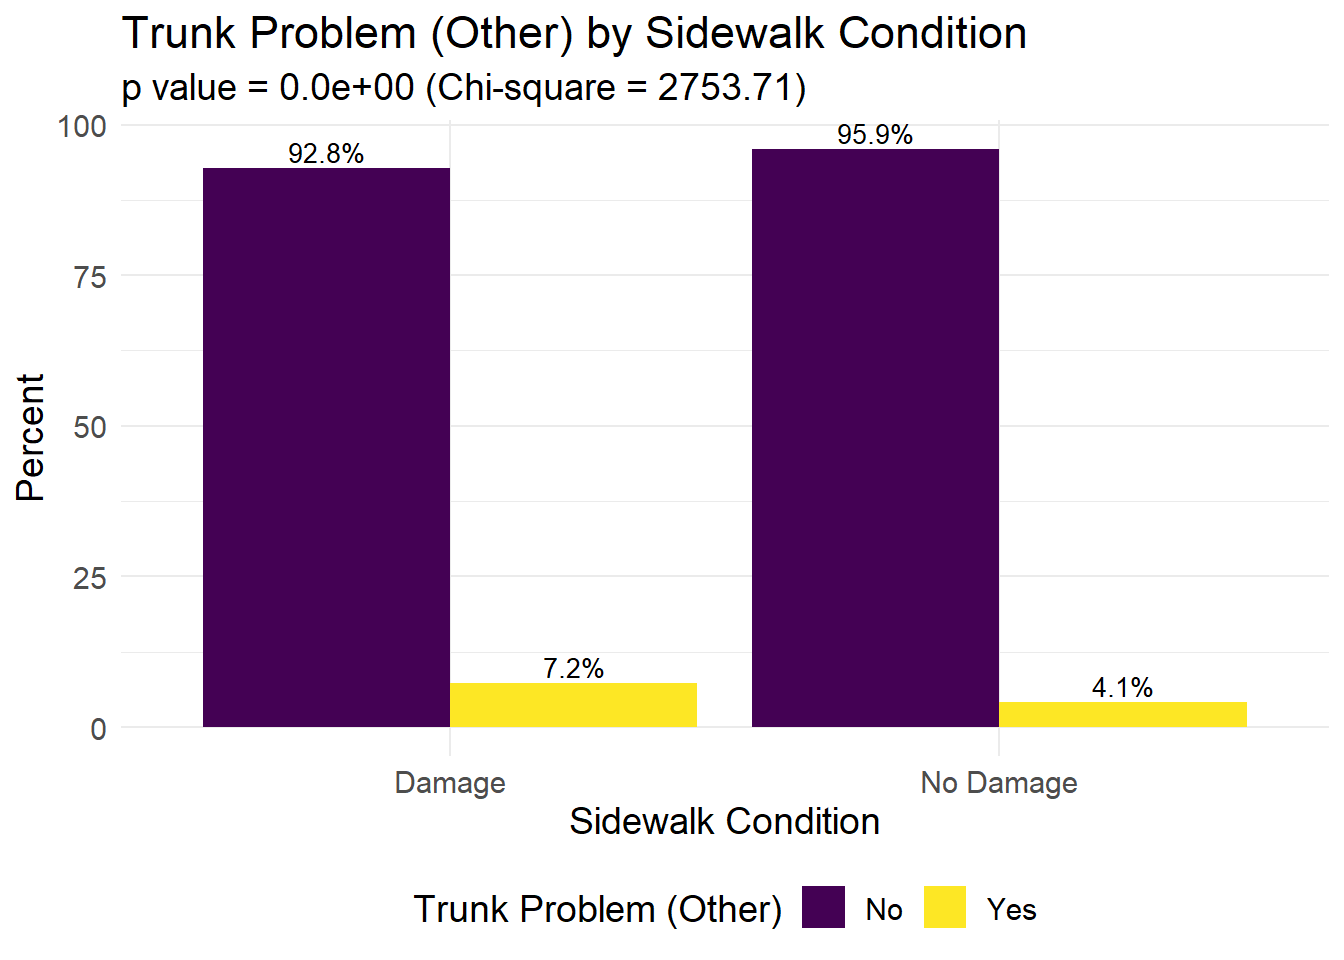
Branches
tree_attribute_plot(df = tree_status_df, exposure_str = exposure, outcome_str = "Branches have Lights")
tree_attribute_plot(df = tree_status_df, exposure_str = exposure, outcome_str = "Branches Problem (Other)")
Vital Status
tree_attribute_plot(df = tree_status_df, exposure_str = exposure, outcome_str = "Alive, Dead, or Stump")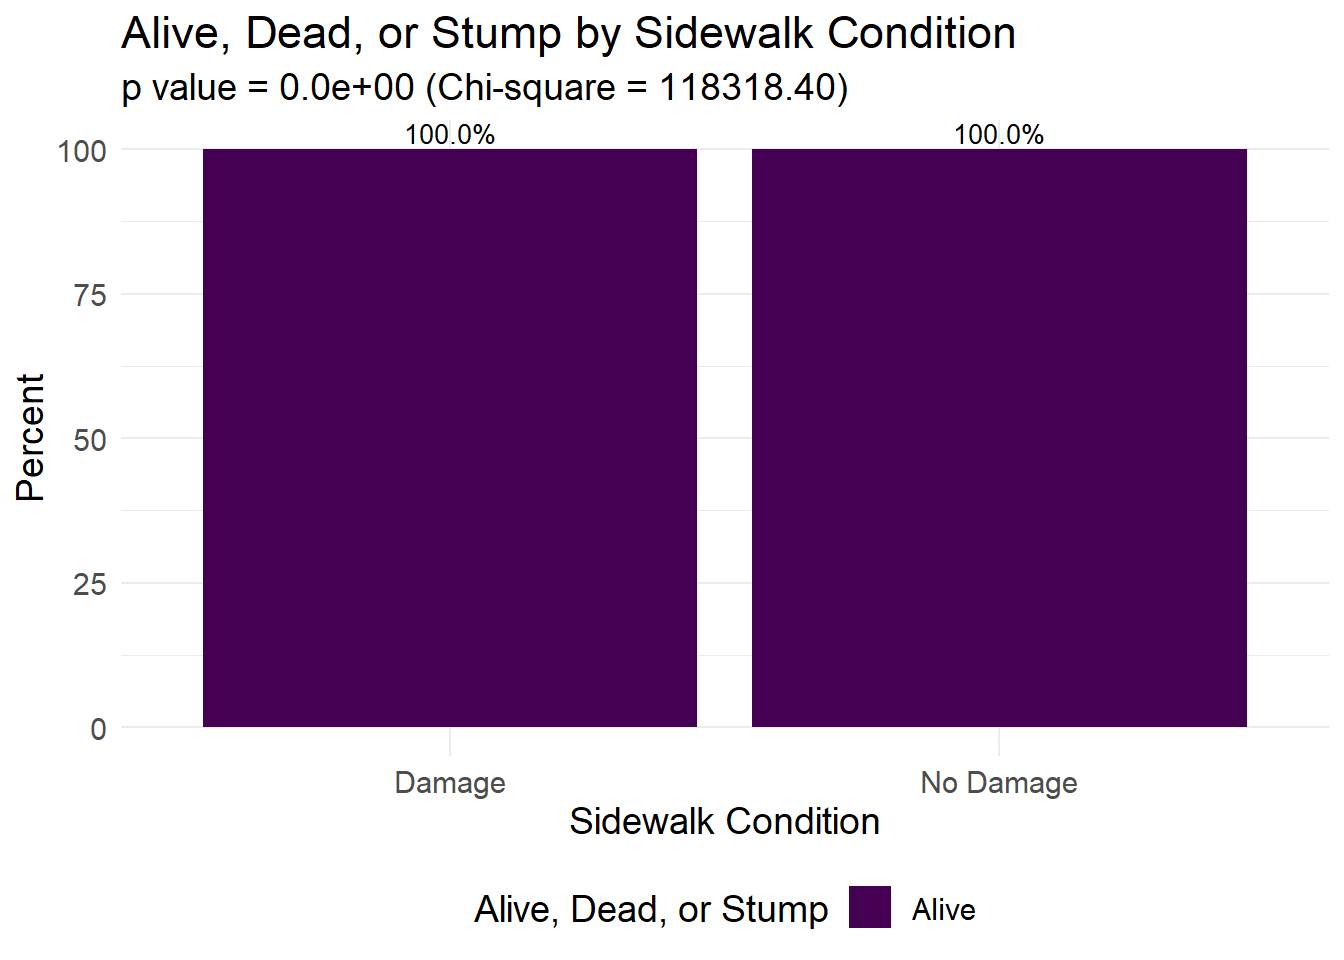
Tree Guards
exposure <- "Guards"Tree Health
tree_attribute_plot(df = tree_status_df, exposure_str = exposure, outcome_str = "Health")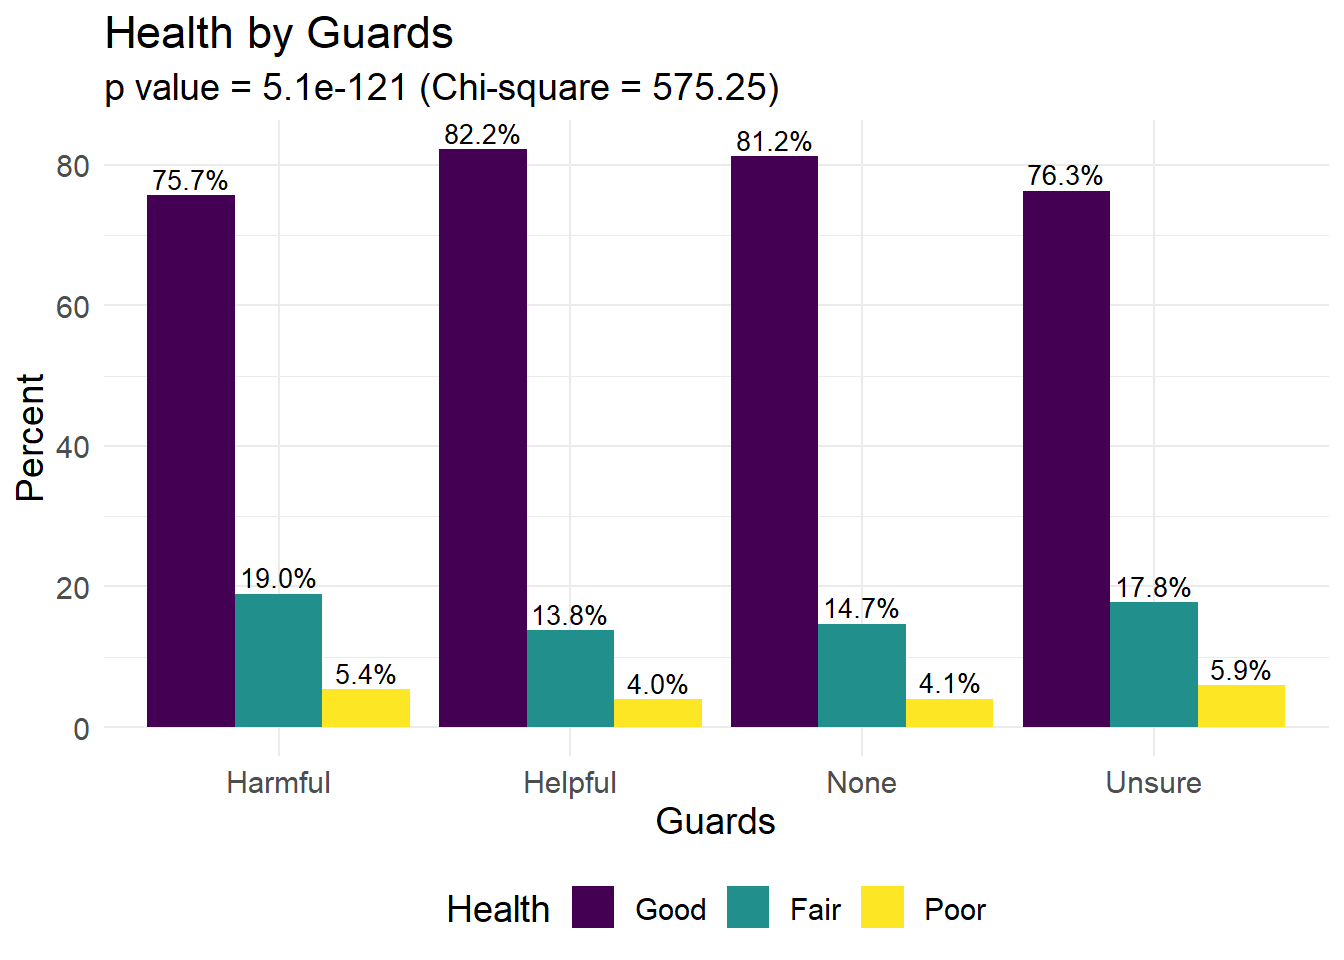
Roots
tree_attribute_plot(df = tree_status_df, exposure_str = exposure, outcome_str = "Roots with Stones")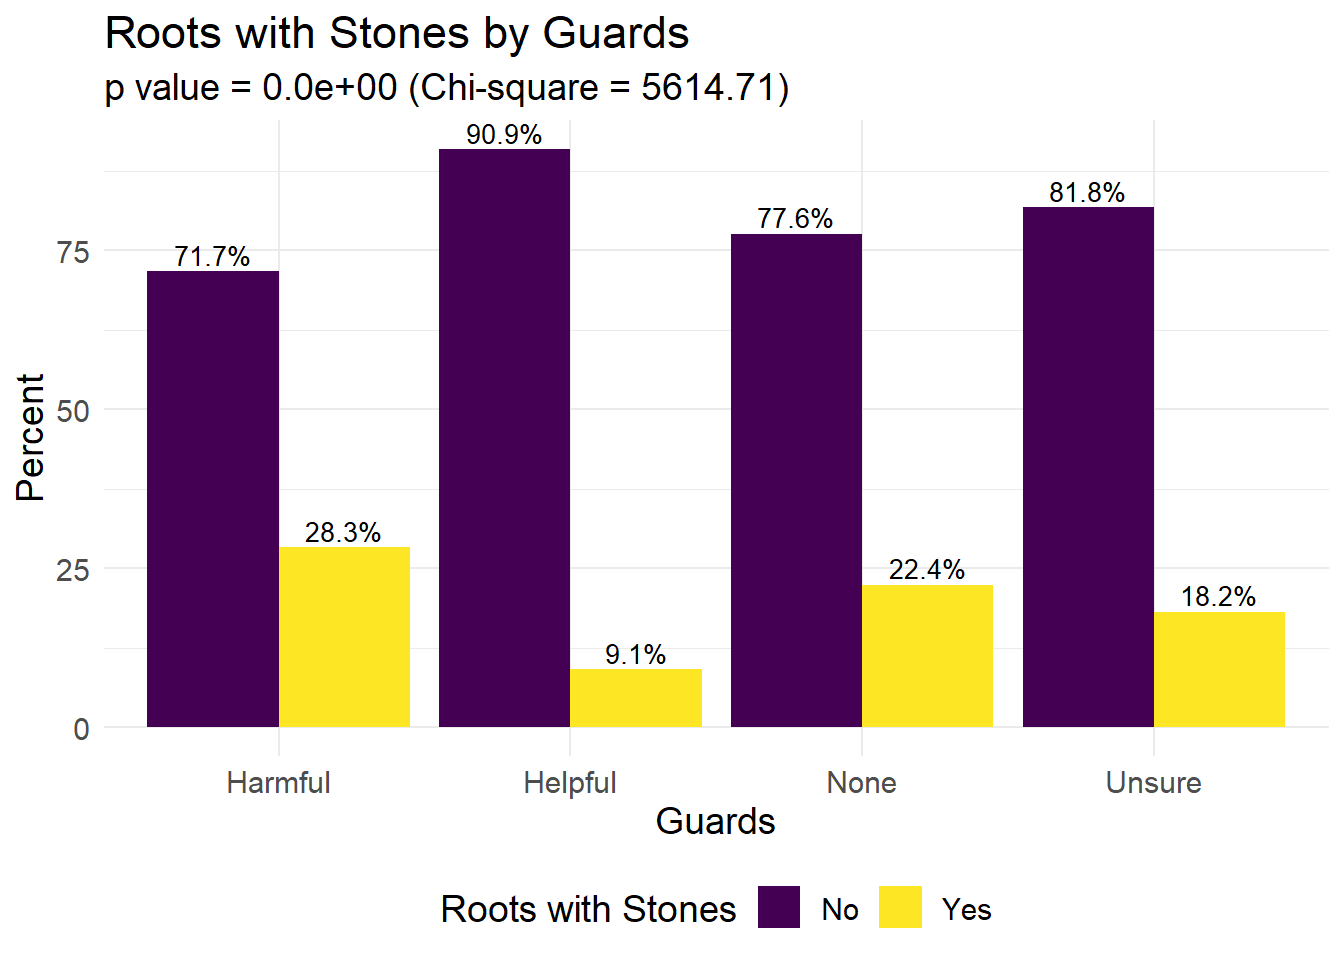
tree_attribute_plot(df = tree_status_df, exposure_str = exposure, outcome_str = "Roots in Grate")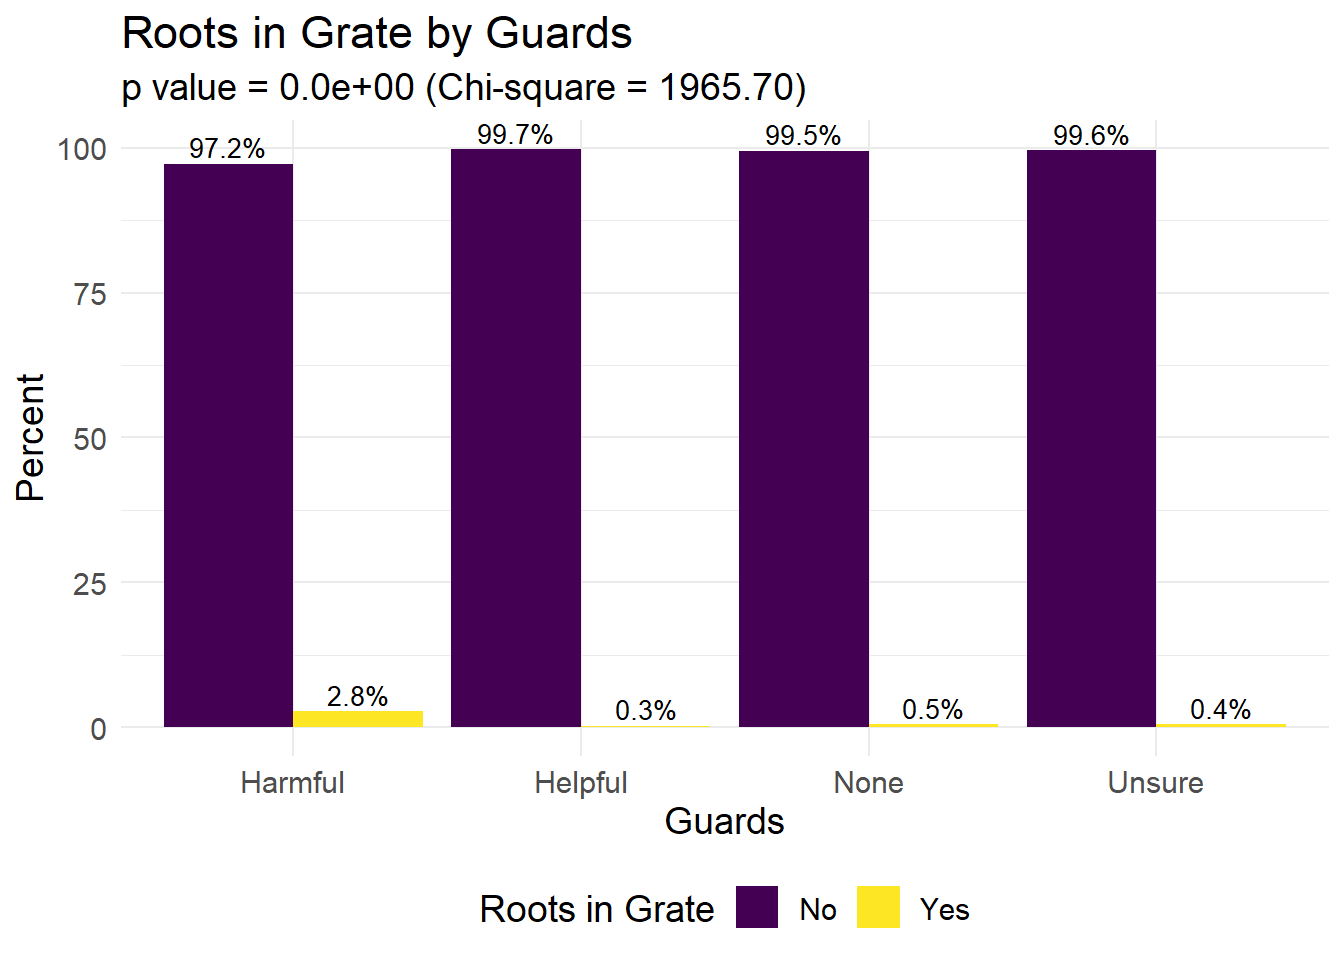
tree_attribute_plot(df = tree_status_df, exposure_str = exposure, outcome_str = "Root Problem (Other)")
Trunk
tree_attribute_plot(df = tree_status_df, exposure_str = exposure, outcome_str = "Trunk has Wires")
tree_attribute_plot(df = tree_status_df, exposure_str = exposure, outcome_str = "Trunk has Lights")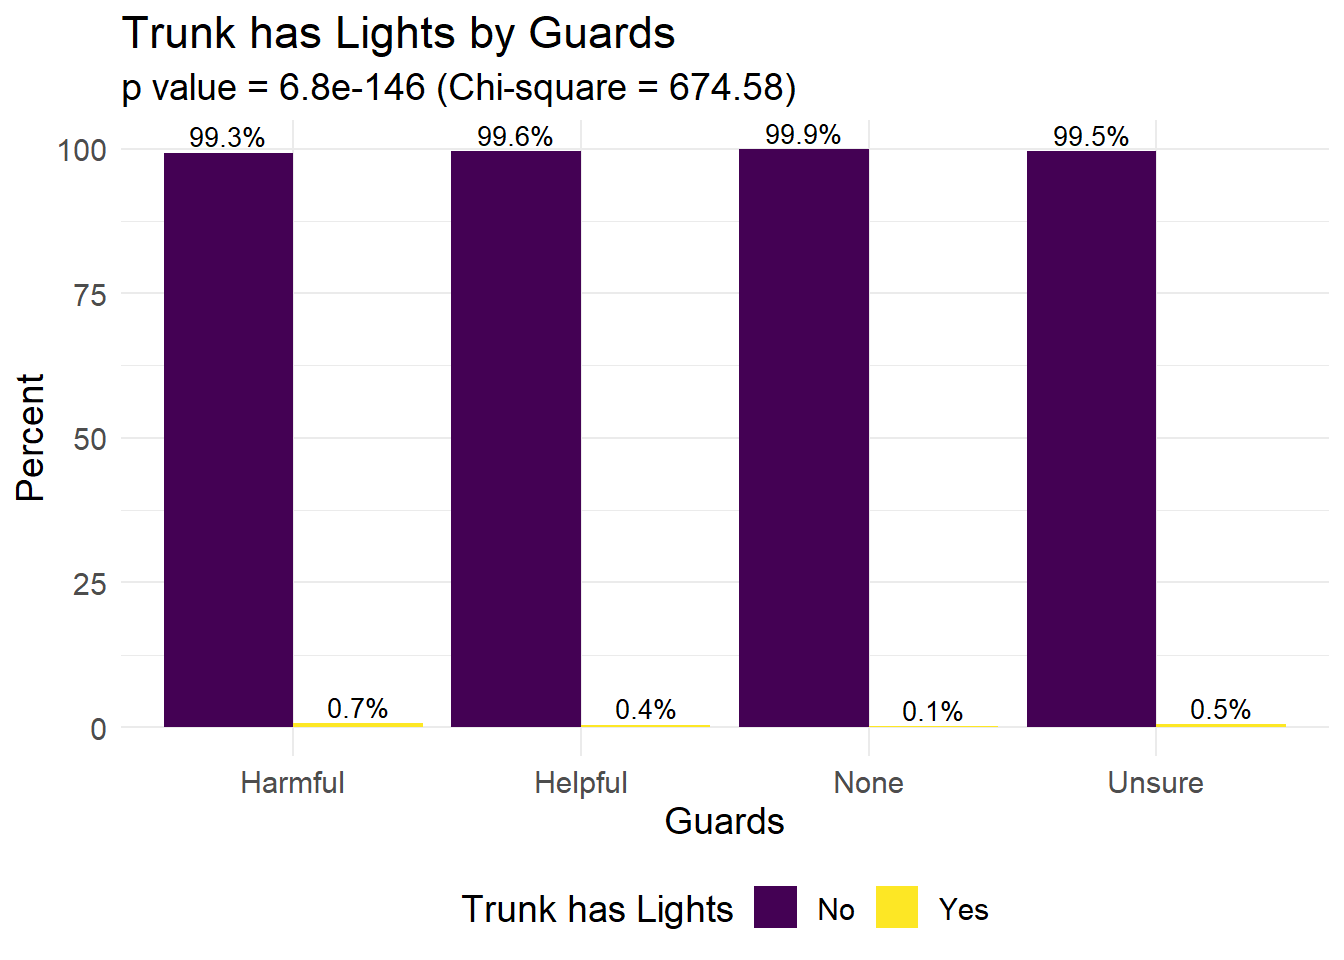
tree_attribute_plot(df = tree_status_df, exposure_str = exposure, outcome_str = "Trunk Problem (Other)")
Branches
tree_attribute_plot(df = tree_status_df, exposure_str = exposure, outcome_str = "Branches have Lights")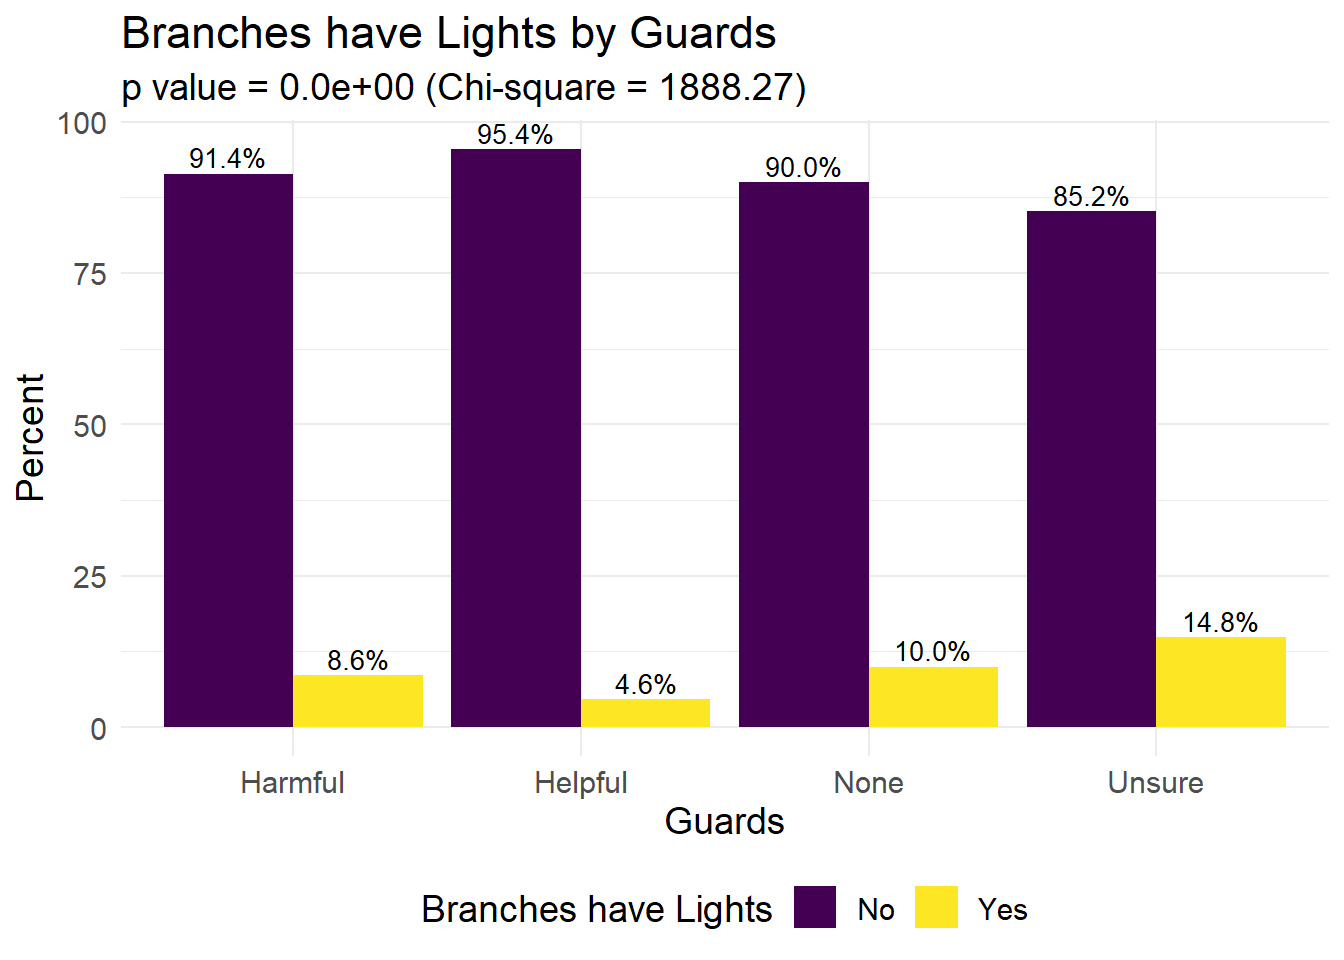
tree_attribute_plot(df = tree_status_df, exposure_str = exposure, outcome_str = "Branches Problem (Other)")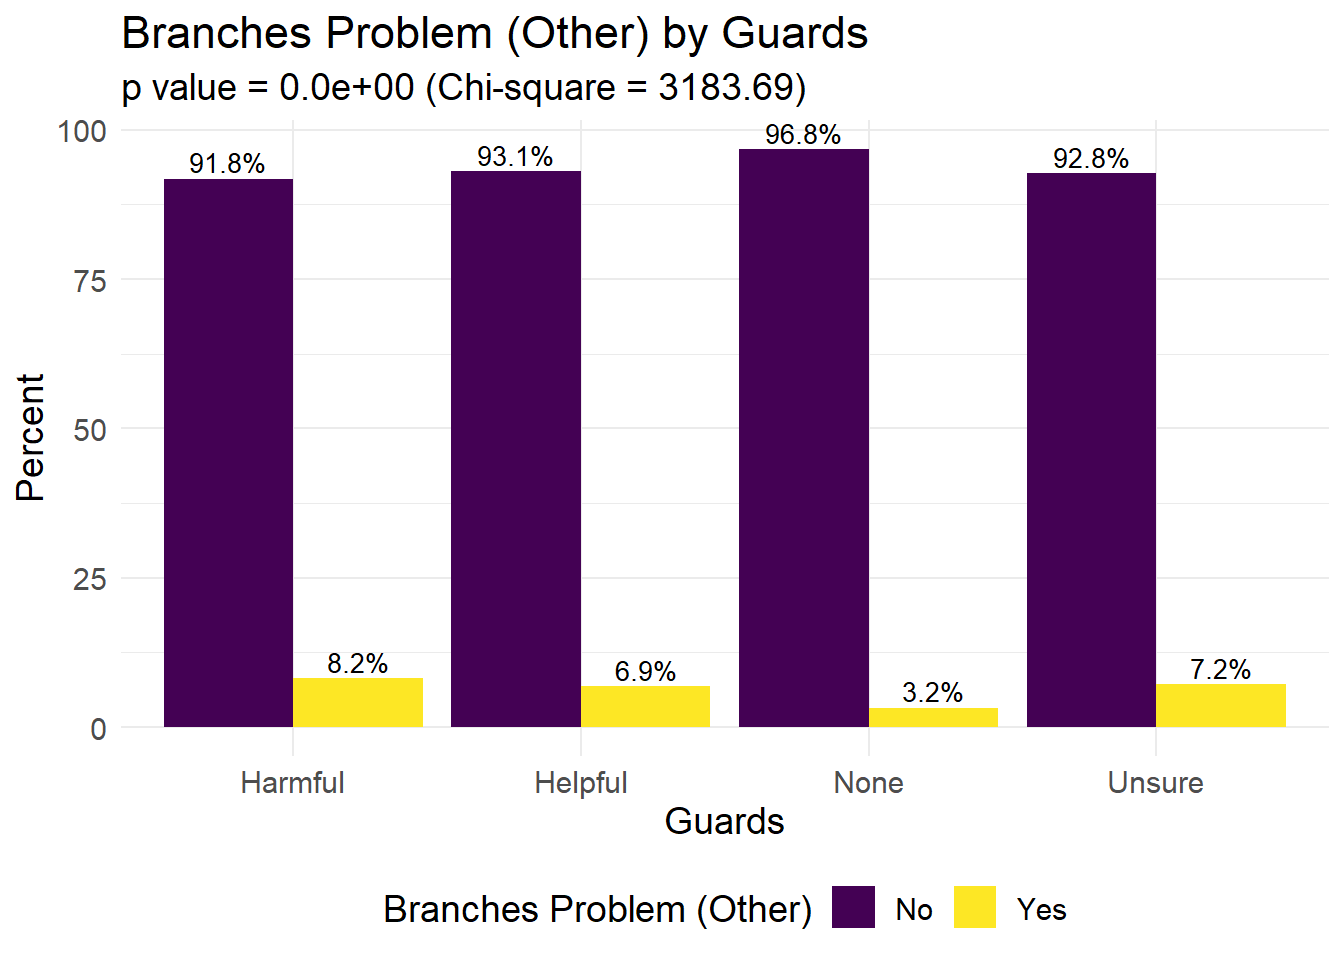
Vital Status
tree_attribute_plot(df = tree_status_df, exposure_str = exposure, outcome_str = "Alive, Dead, or Stump")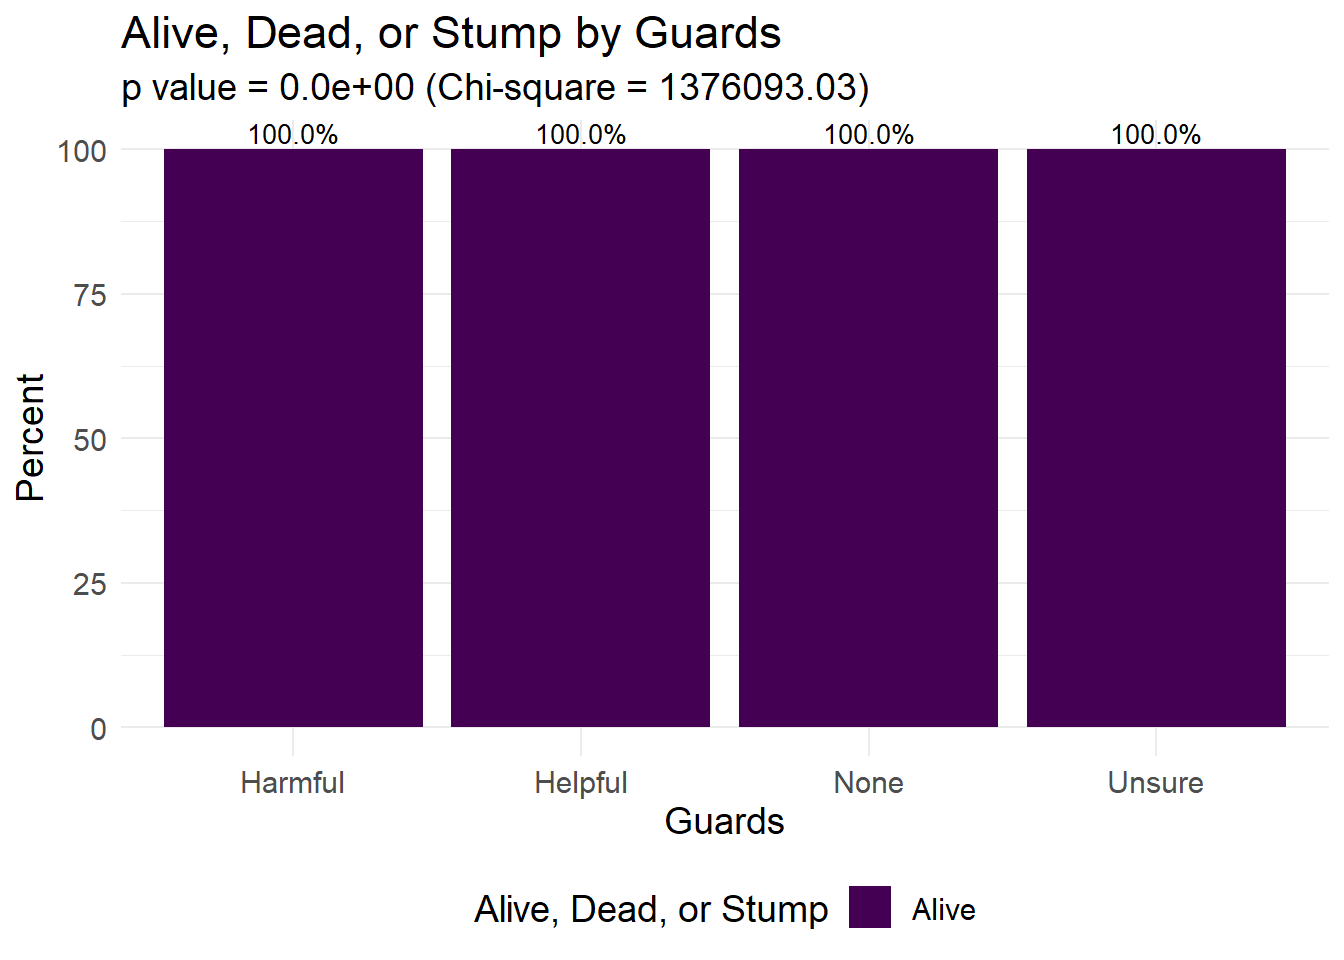
Tree Health
exposure <- "Health"Roots
tree_attribute_plot(df = tree_status_df, exposure_str = exposure, outcome_str = "Roots with Stones")
tree_attribute_plot(df = tree_status_df, exposure_str = exposure, outcome_str = "Roots in Grate")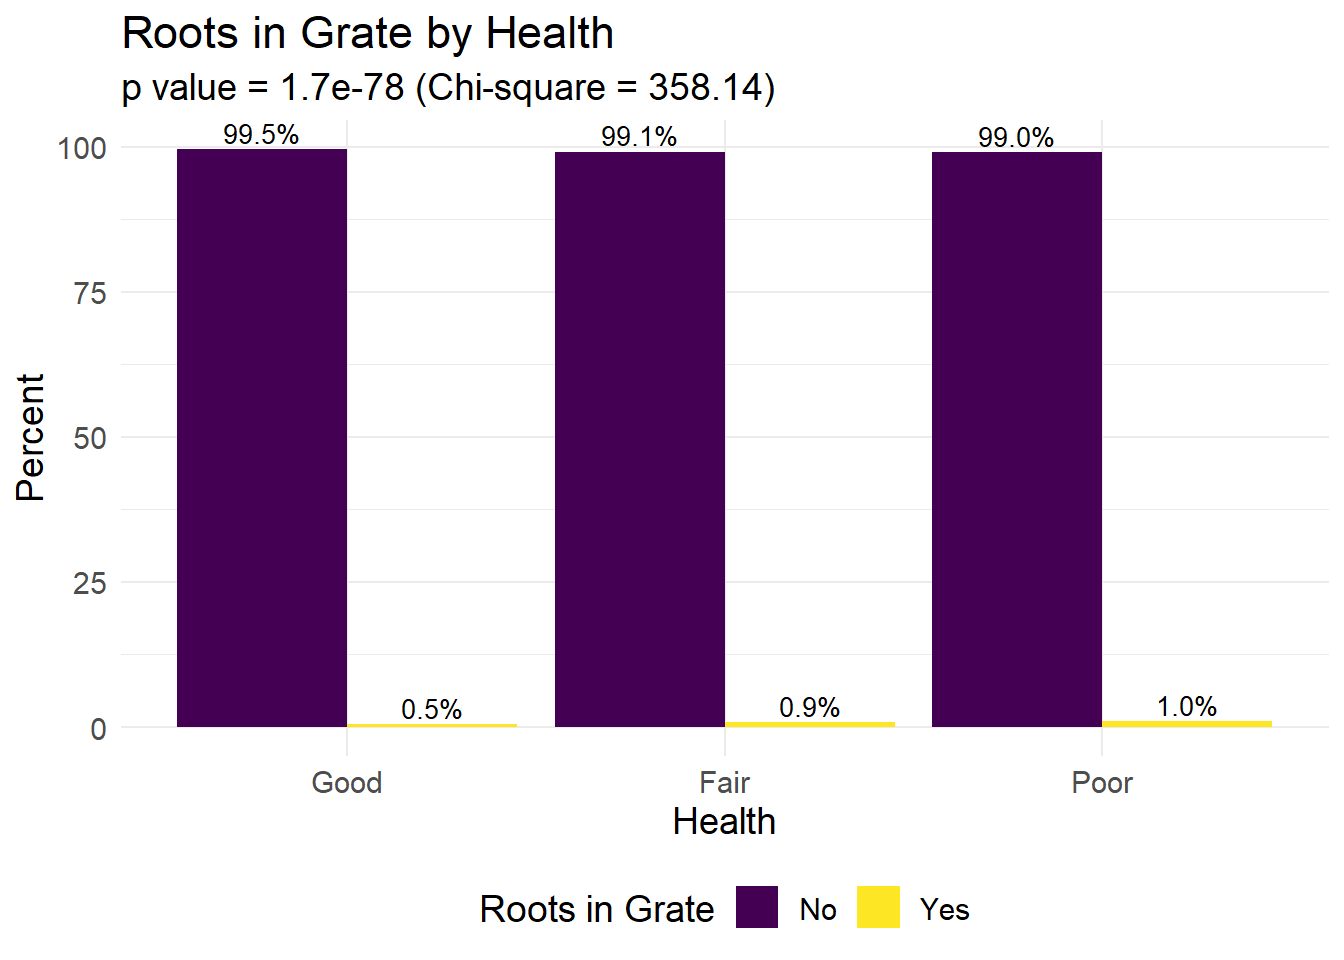
tree_attribute_plot(df = tree_status_df, exposure_str = exposure, outcome_str = "Root Problem (Other)")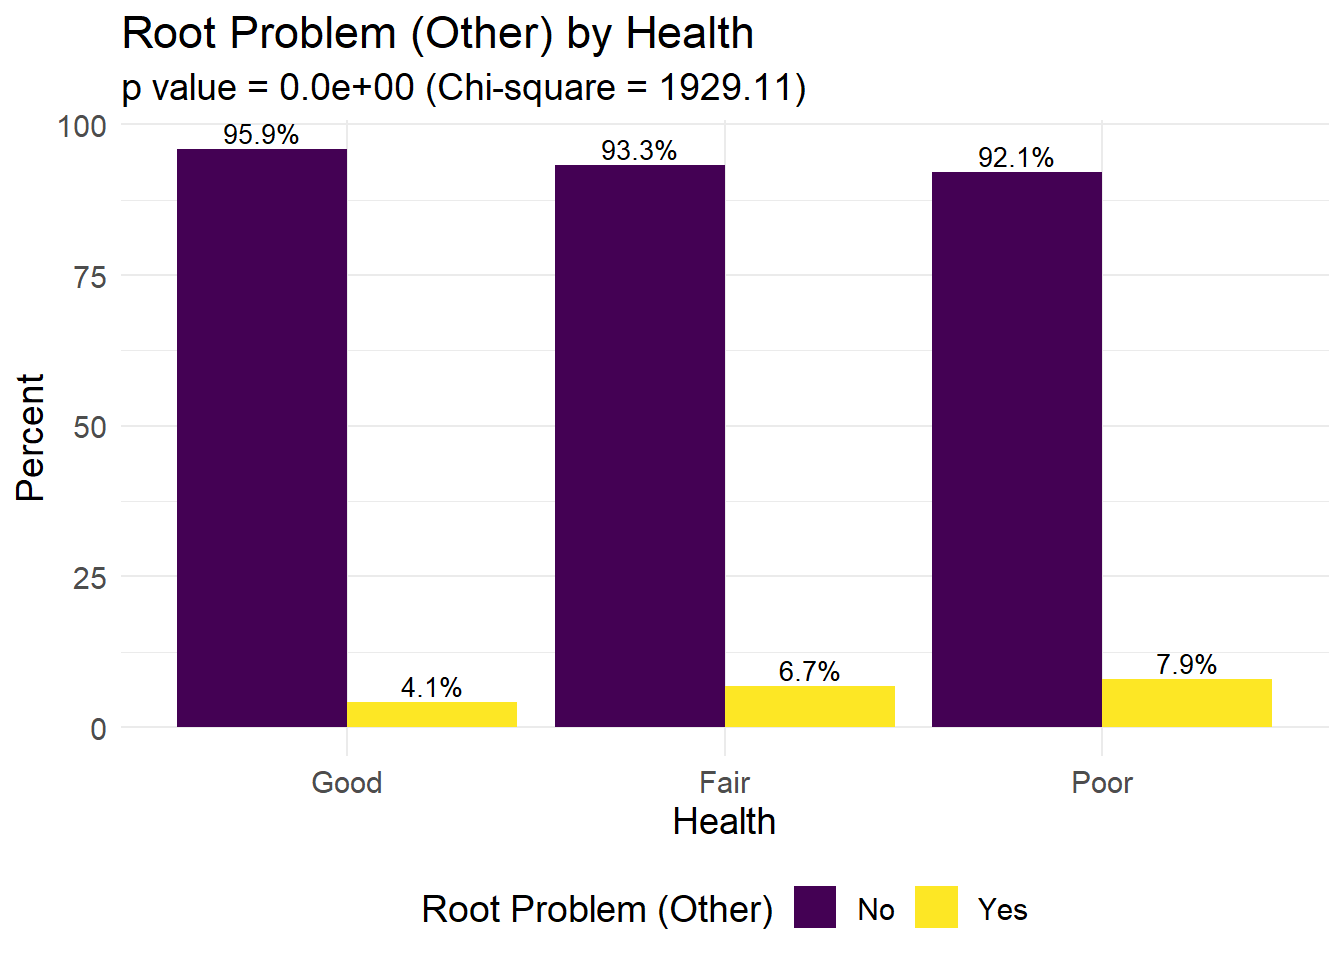
Trunk
tree_attribute_plot(df = tree_status_df, exposure_str = exposure, outcome_str = "Trunk has Wires")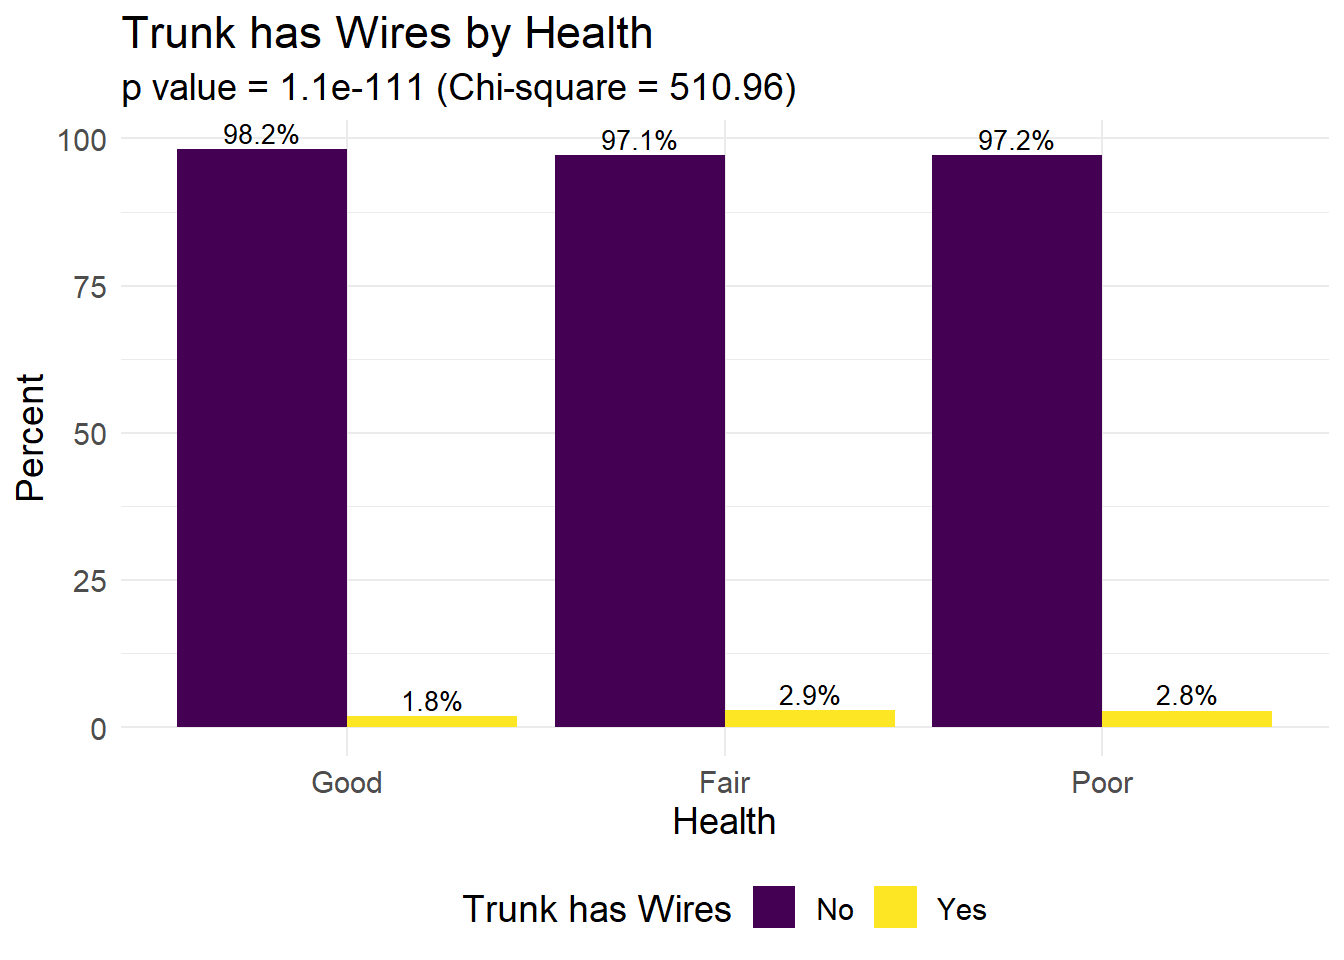
tree_attribute_plot(df = tree_status_df, exposure_str = exposure, outcome_str = "Trunk has Lights")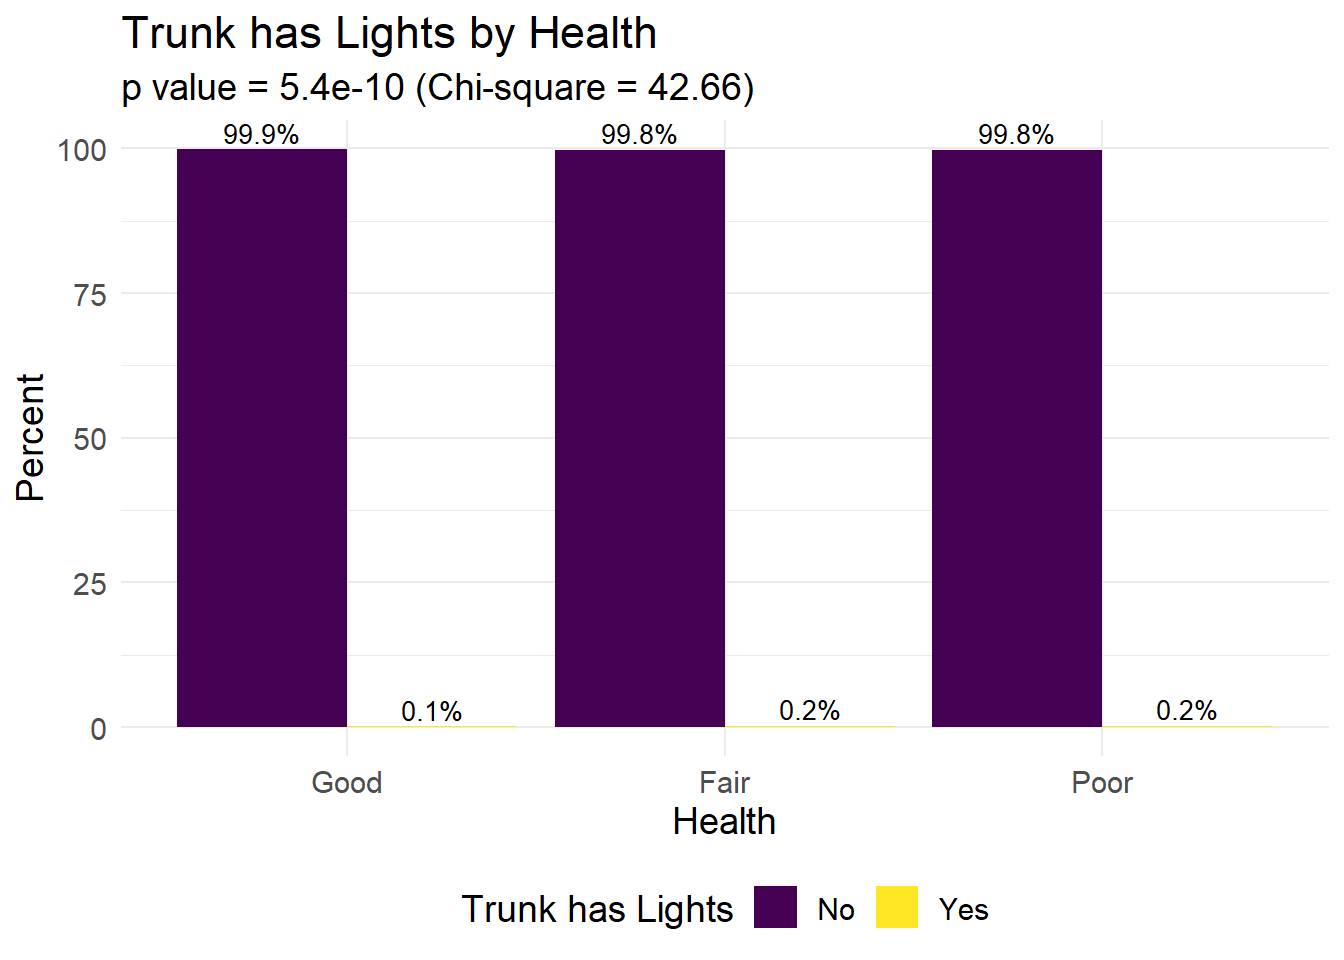
tree_attribute_plot(df = tree_status_df, exposure_str = exposure, outcome_str = "Trunk Problem (Other)")
Branches
tree_attribute_plot(df = tree_status_df, exposure_str = exposure, outcome_str = "Branches have Lights")
tree_attribute_plot(df = tree_status_df, exposure_str = exposure, outcome_str = "Branches Problem (Other)")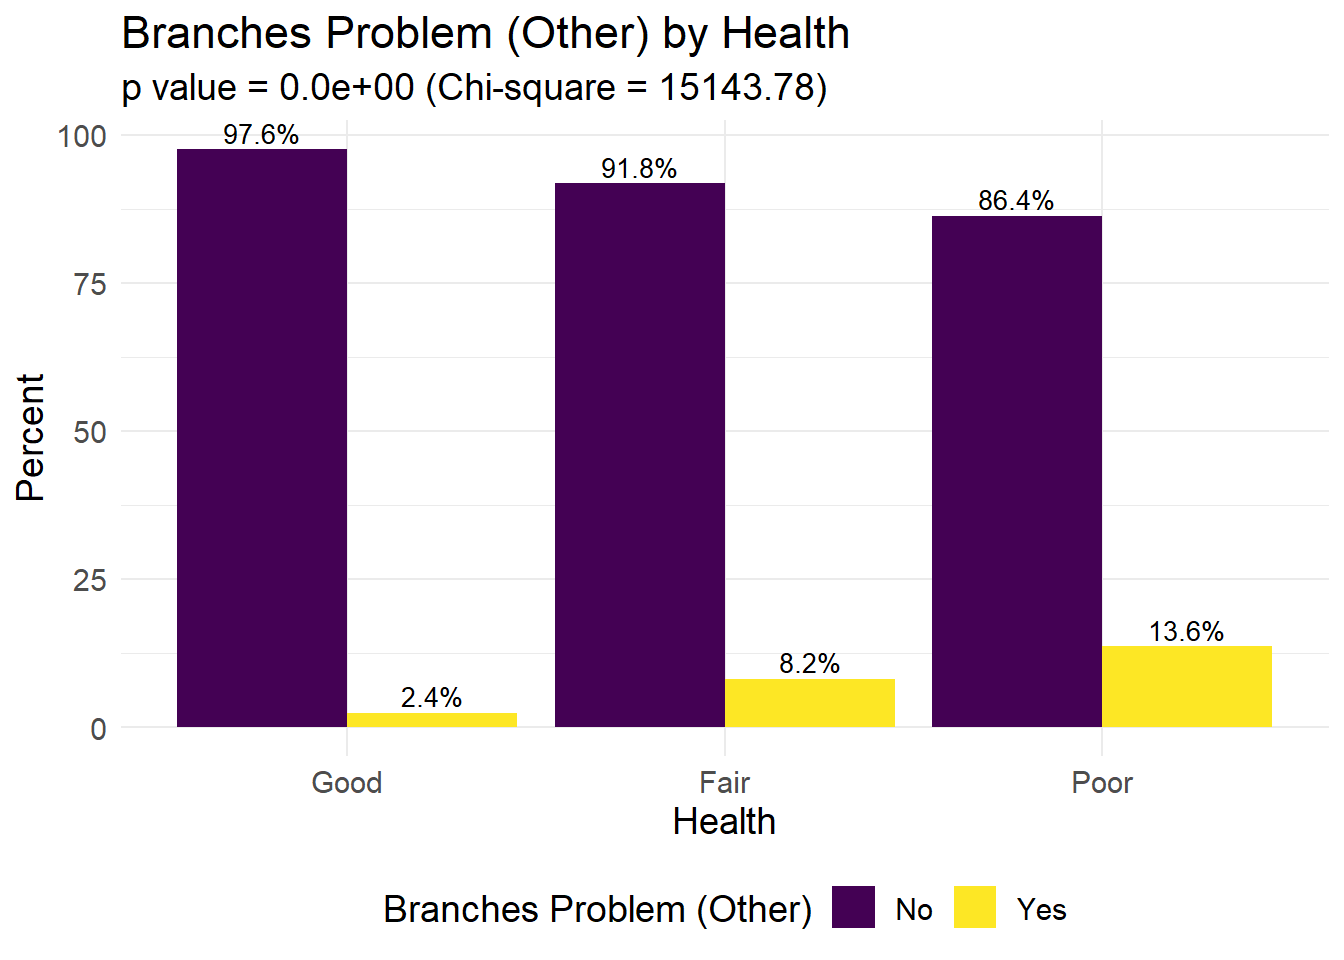
Distribution by Borough and Overall in NYC
The section below shows the overall distribution of different tree surroundings, qualities, attributes, and health. It can be explored by borough or as an overall summary of the entire city.
Distribution by Borough
exposure <- "Borough"Tree Health
tree_attribute_plot(df = tree_status_df, exposure_str = exposure, outcome_str = "Health")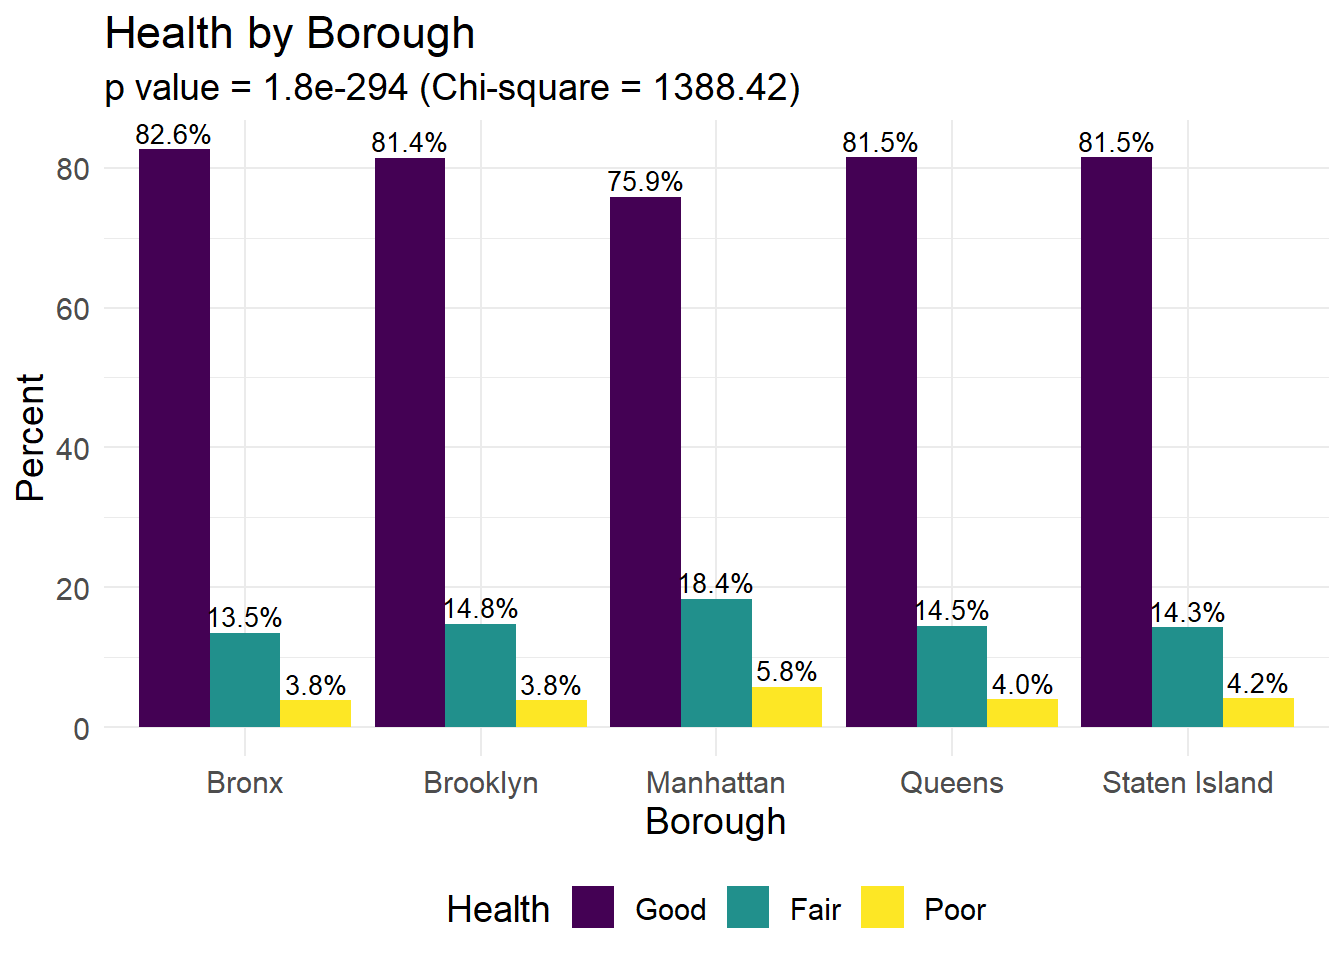
This figure shows the distribution of different attributes of trees and their status across all of NYC. For example, we see that 81.1% of trees are in “good” health, 14.8% of trees are in “fair” health, and 4.1% of trees are in “poor” health. Notably, 28.7% of sidewalks are damaged (71.2% not damaged). The majority of trees (87.8%) do not have guards and 20.5% of tree roots have stones.
Tree Surroundings
tree_attribute_plot(df = tree_status_df, exposure_str = exposure, outcome_str = "Sidewalk Condition")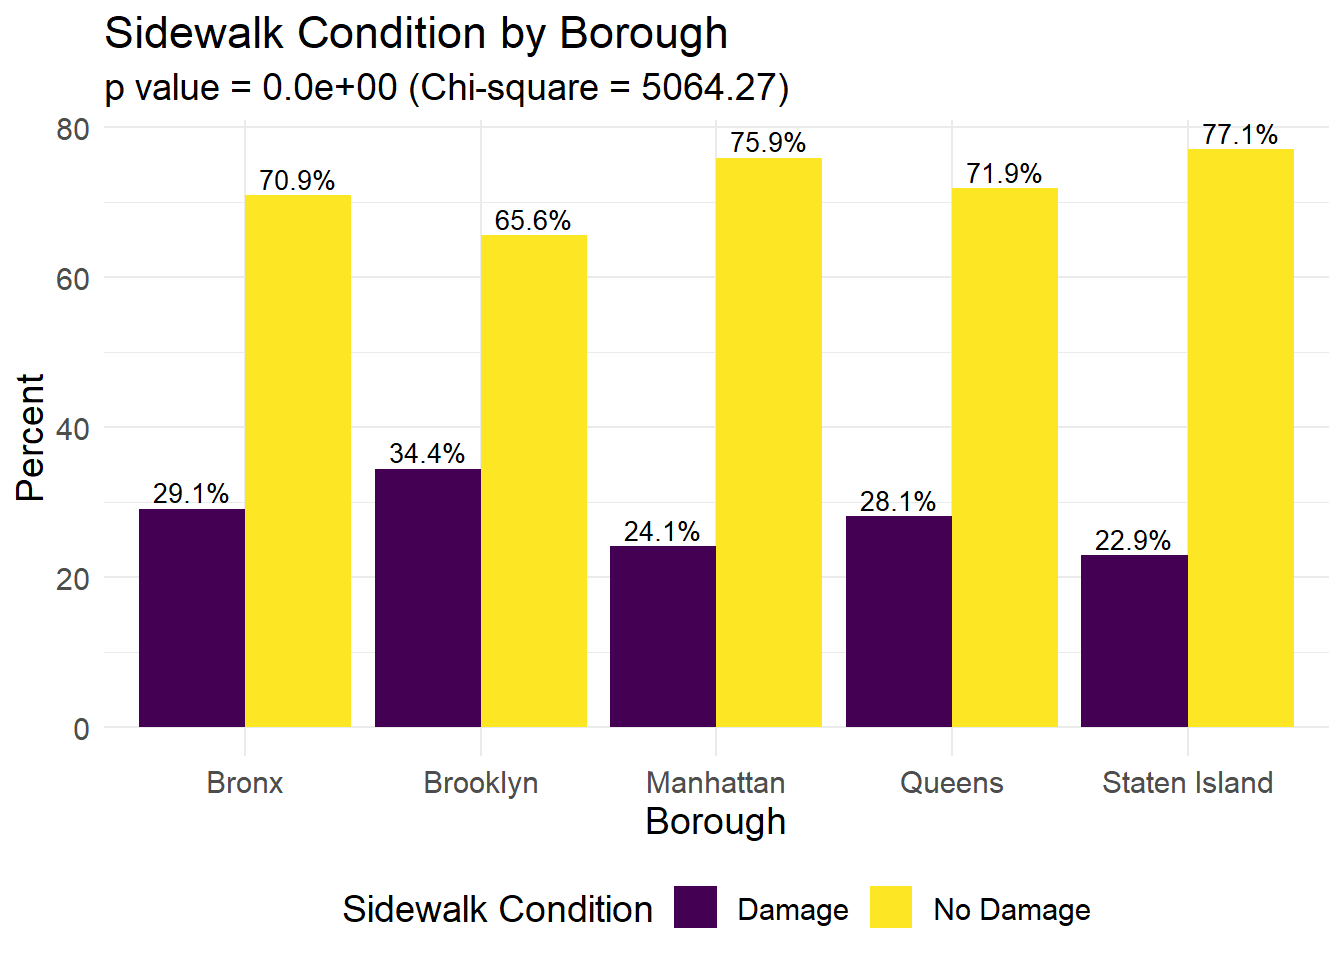
tree_attribute_plot(df = tree_status_df, exposure_str = exposure, outcome_str = "Curb Location")
tree_attribute_plot(df = tree_status_df, exposure_str = exposure, outcome_str = "Guards")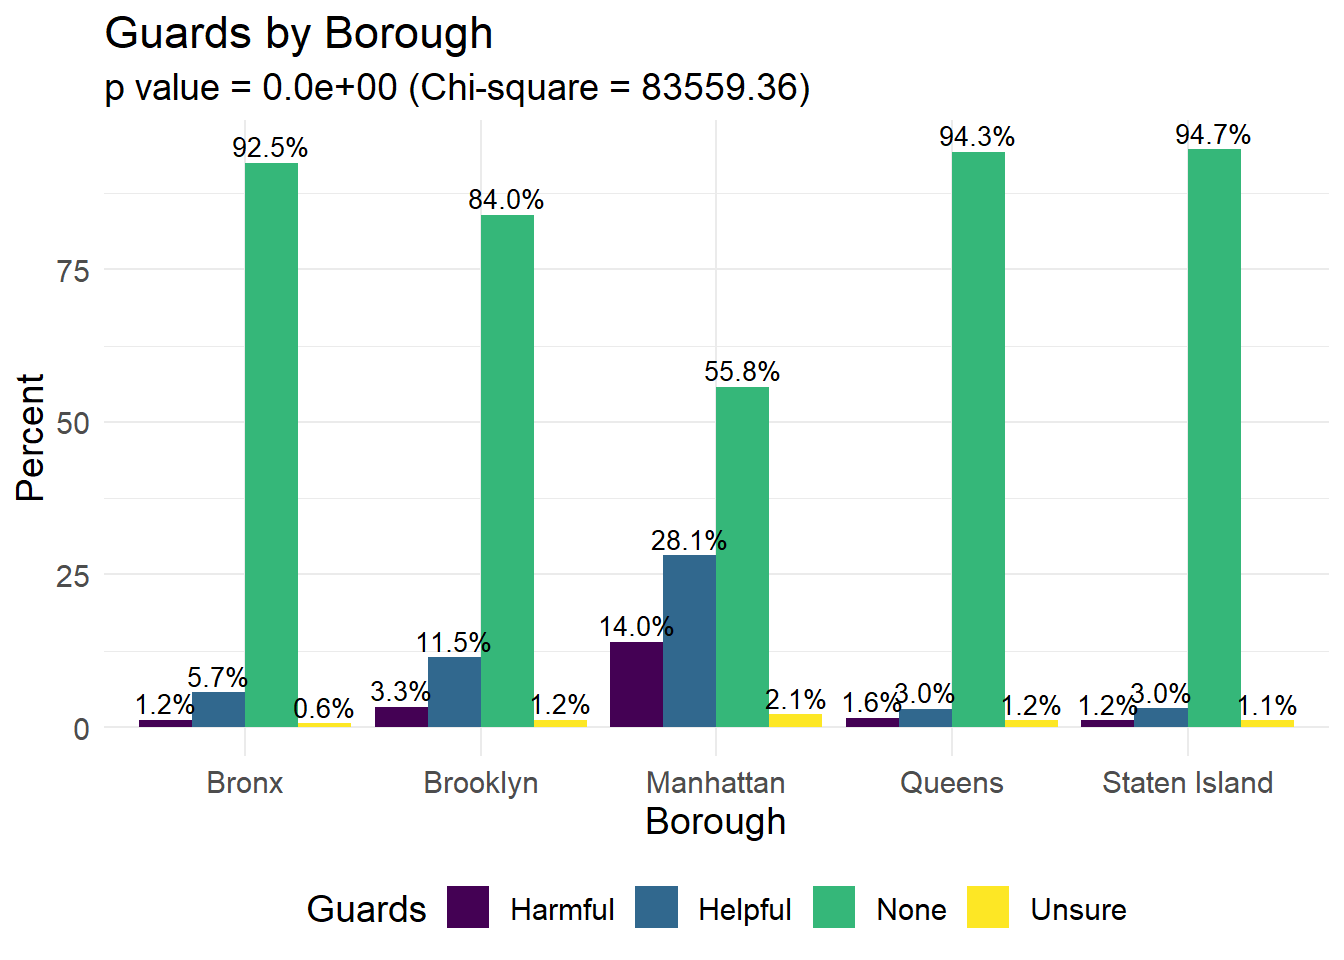
Roots
tree_attribute_plot(df = tree_status_df, exposure_str = exposure, outcome_str = "Roots with Stones")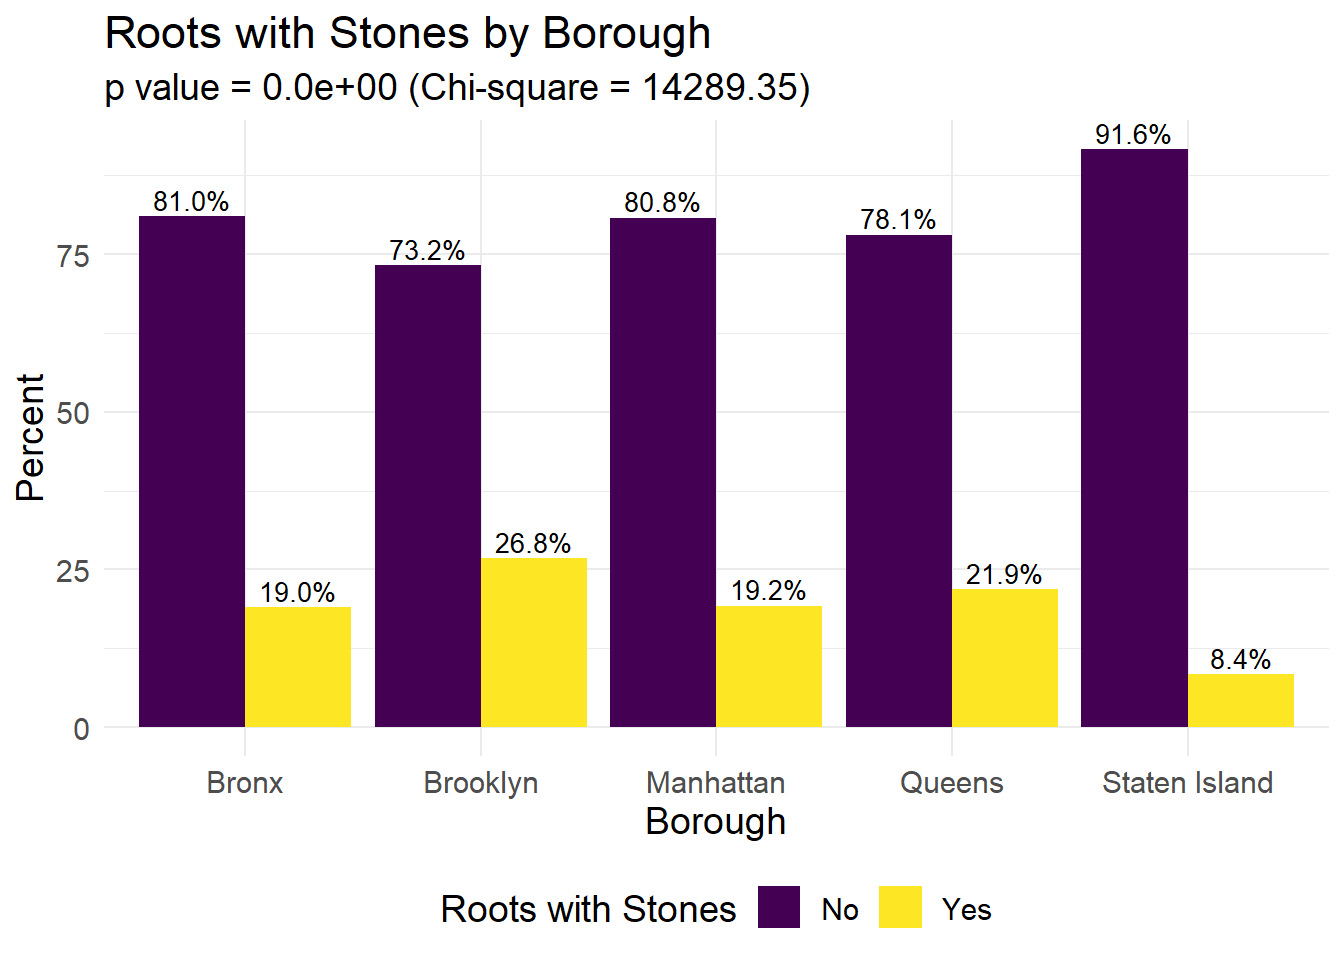
tree_attribute_plot(df = tree_status_df, exposure_str = exposure, outcome_str = "Roots in Grate")
tree_attribute_plot(df = tree_status_df, exposure_str = exposure, outcome_str = "Root Problem (Other)")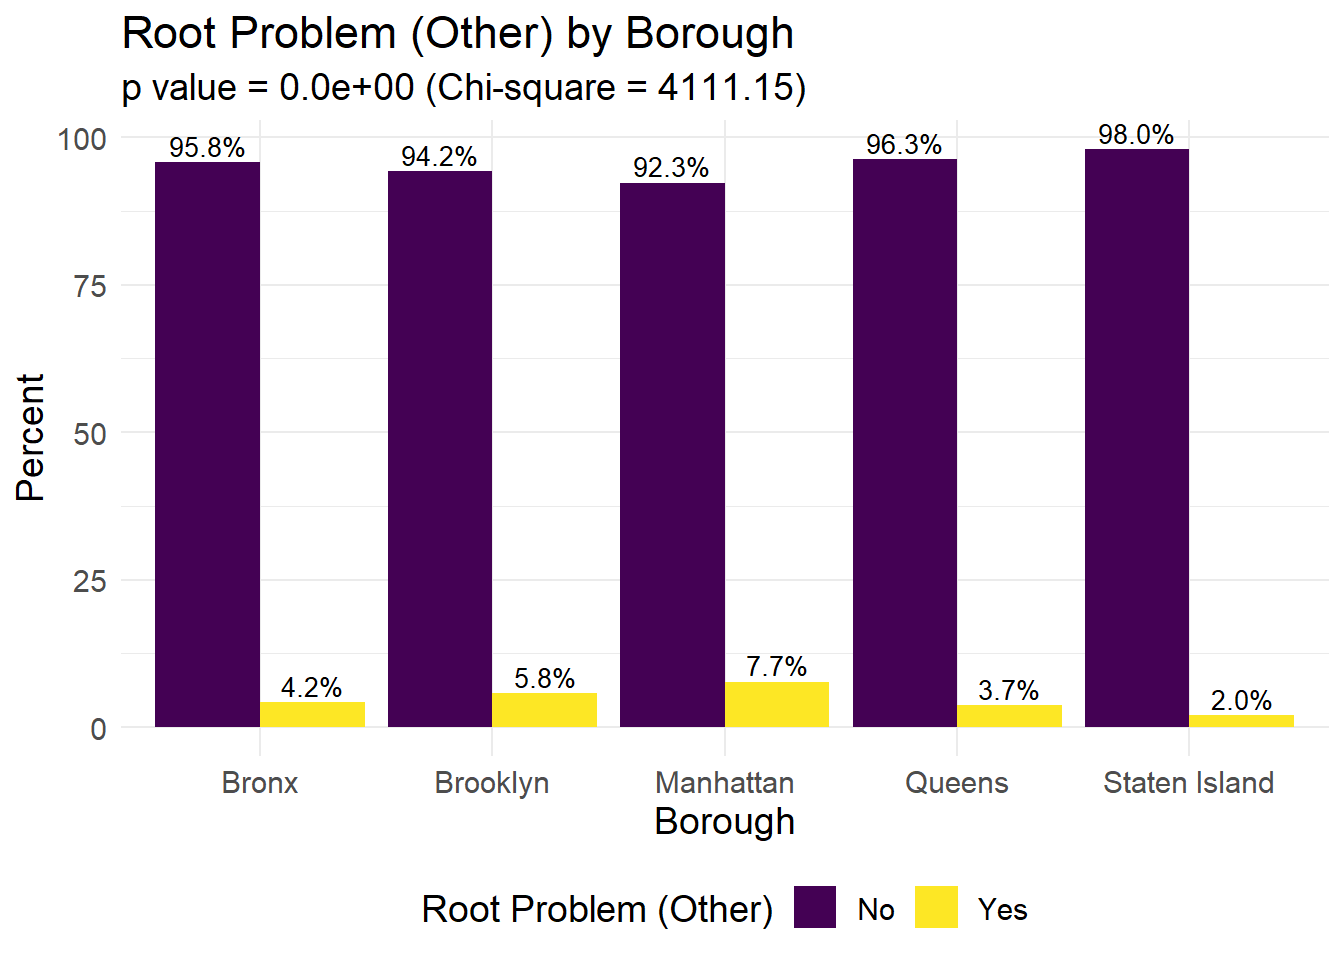
Trunk
tree_attribute_plot(df = tree_status_df, exposure_str = exposure, outcome_str = "Trunk has Wires")
tree_attribute_plot(df = tree_status_df, exposure_str = exposure, outcome_str = "Trunk has Lights")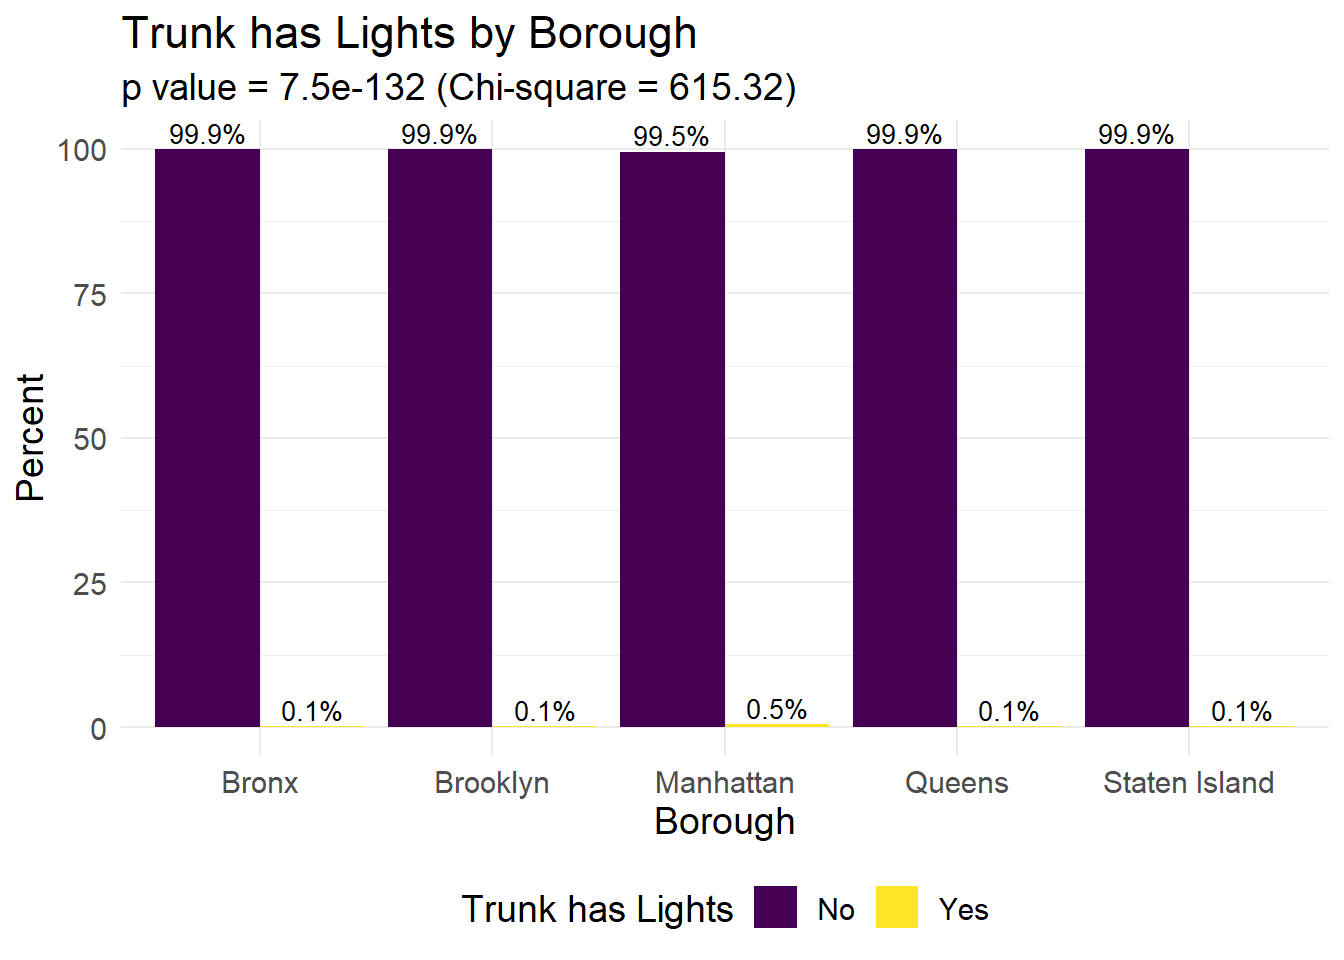
tree_attribute_plot(df = tree_status_df, exposure_str = exposure, outcome_str = "Trunk Problem (Other)")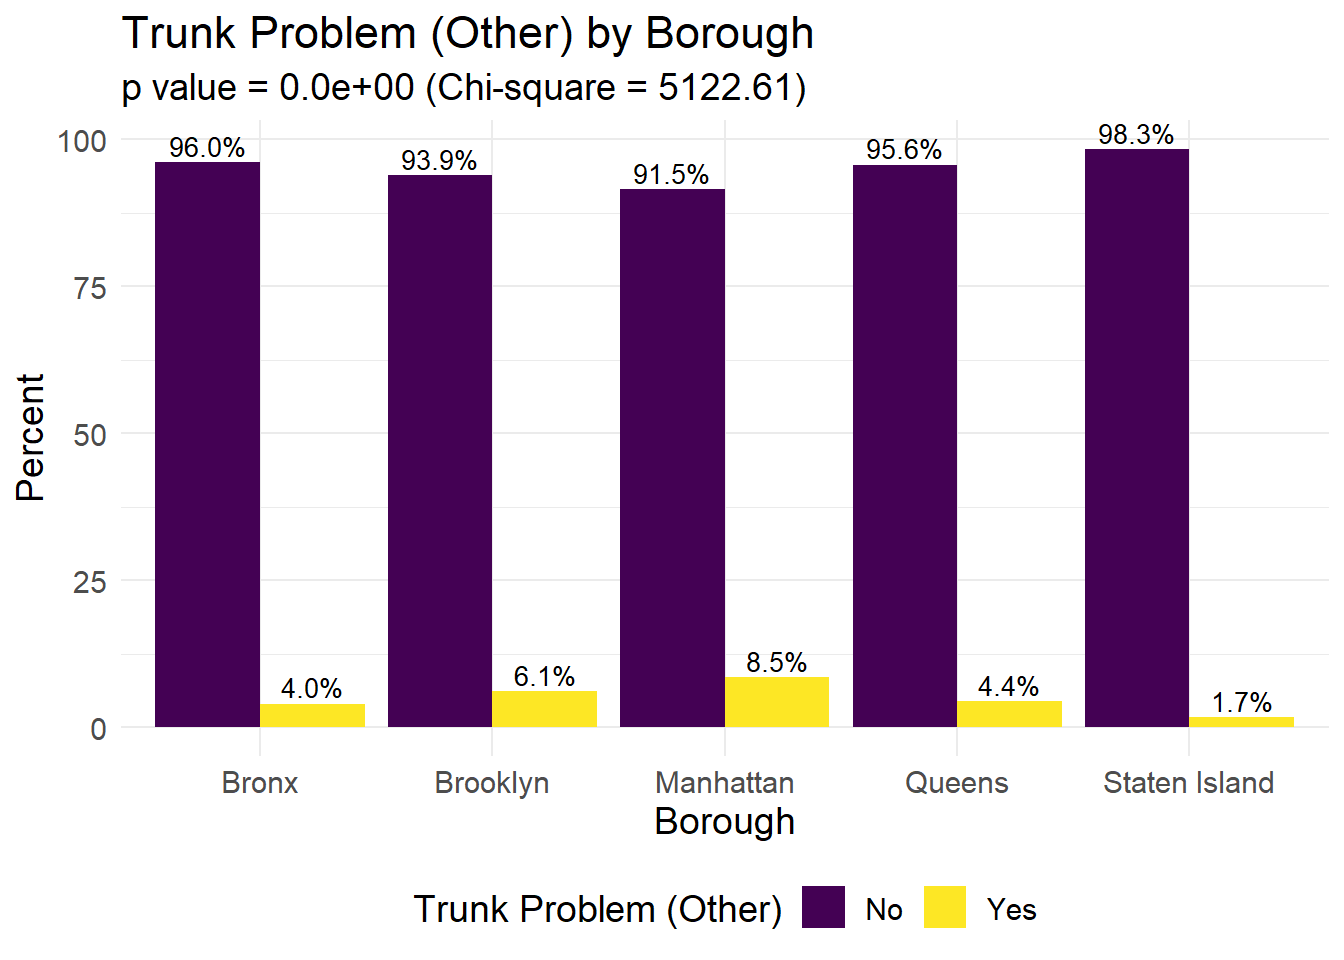
Branches
tree_attribute_plot(df = tree_status_df, exposure_str = exposure, outcome_str = "Branches have Lights")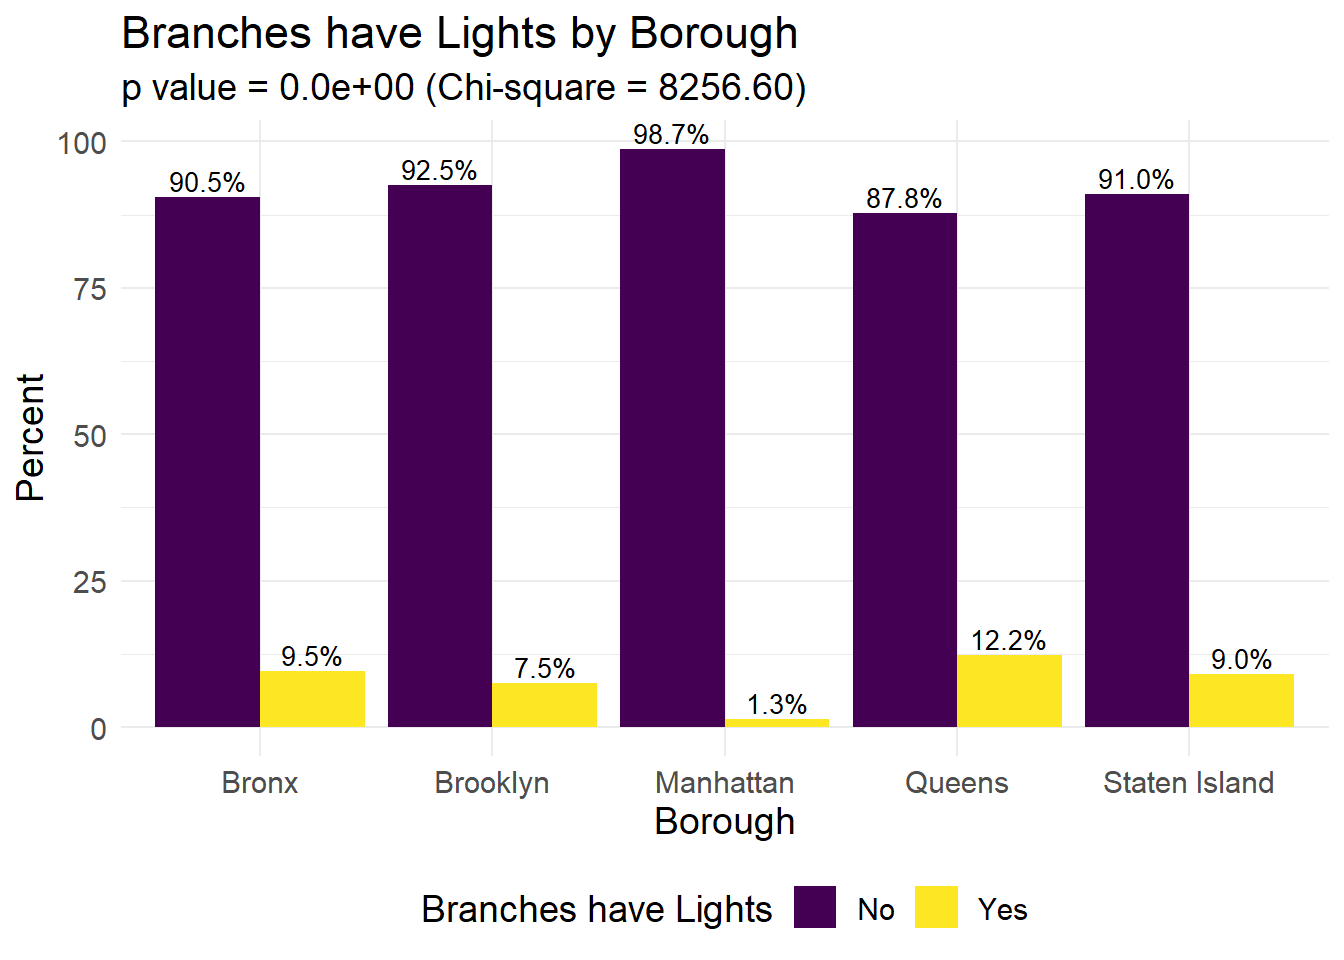
tree_attribute_plot(df = tree_status_df, exposure_str = exposure, outcome_str = "Branches Problem (Other)")
tree_attribute_plot(df = tree_status_df, exposure_str = exposure, outcome_str = "Branches with Shoes")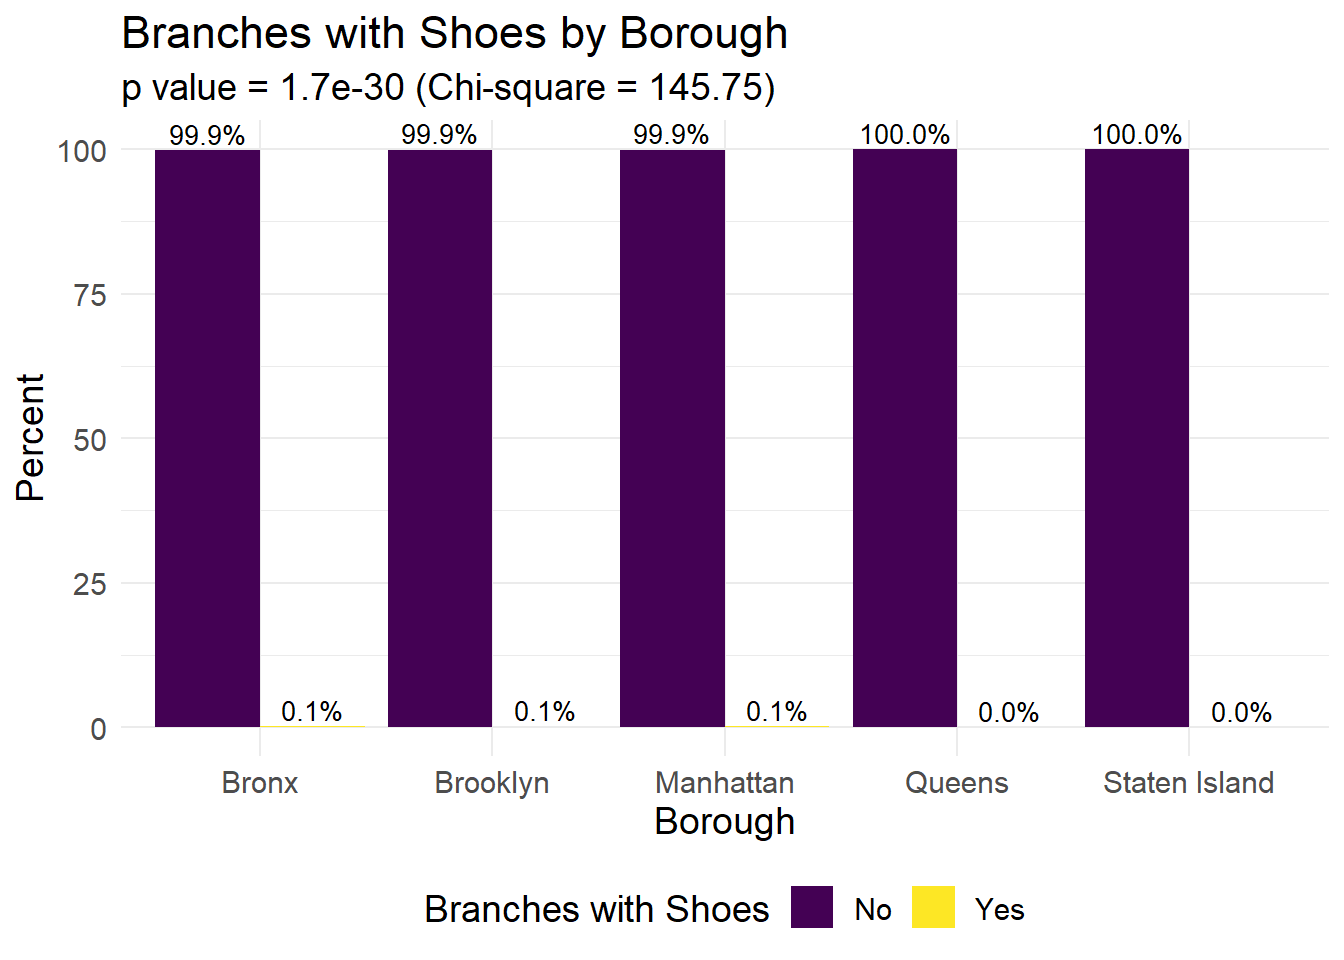
tree_status_df %>%
  filter(`Branches with Shoes` == "Yes") %>%
  group_by(Borough) %>%
  count(`Branches with Shoes`) %>%
  ggplot(aes(x = Borough, y = n, fill = Borough)) +
  geom_bar(stat = 'identity', position = 'dodge') +
  labs(title = "Number of Trees with Shoes in Branches",
       x = "Borough",
       y = "Number of Trees")
Vital Status
tree_attribute_plot(df = tree_status_df, exposure_str = exposure, outcome_str = "Alive, Dead, or Stump")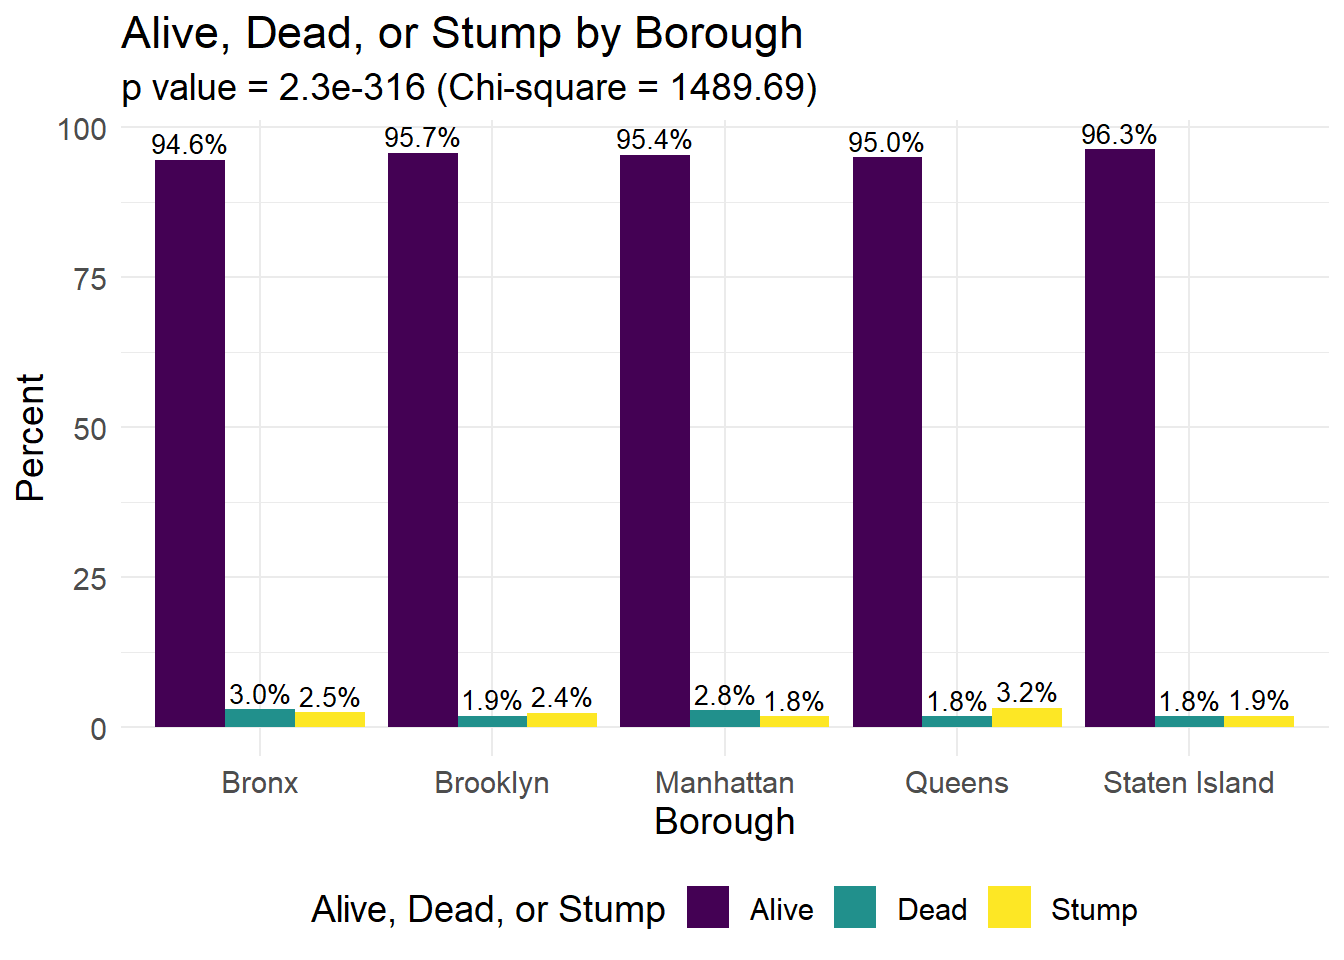
Overall NYC
exposure <- "All of NYC"Tree Health
tree_attribute_plot(df = tree_status_df, exposure_str = exposure, outcome_str = "Health")
Tree Location
tree_attribute_plot(df = tree_status_df, exposure_str = exposure, outcome_str = "Sidewalk Condition")
tree_attribute_plot(df = tree_status_df, exposure_str = exposure, outcome_str = "Curb Location")
tree_attribute_plot(df = tree_status_df, exposure_str = exposure, outcome_str = "Guards")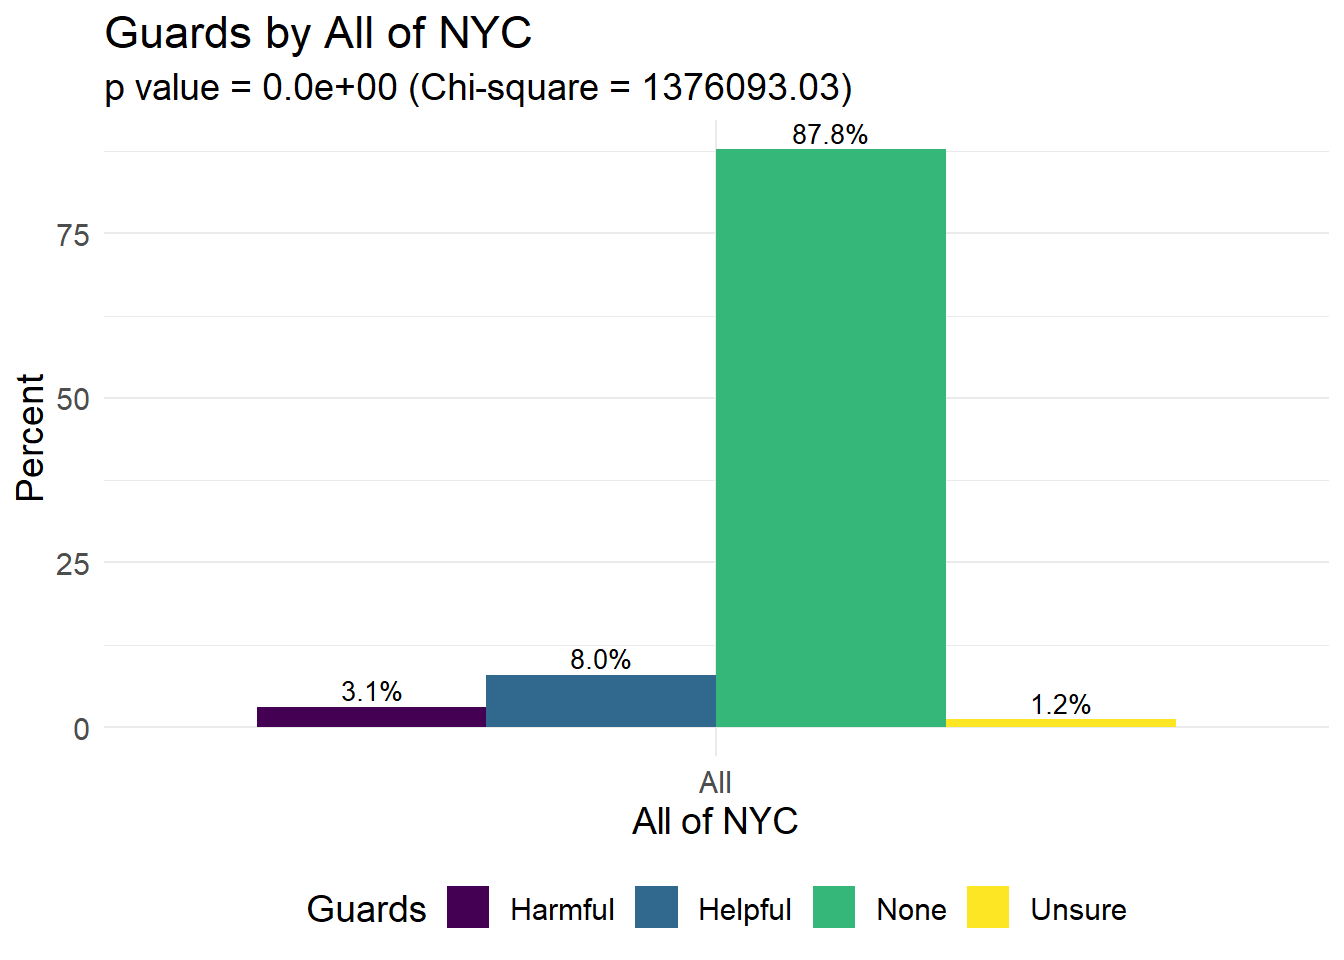
Roots
tree_attribute_plot(df = tree_status_df, exposure_str = exposure, outcome_str = "Roots with Stones")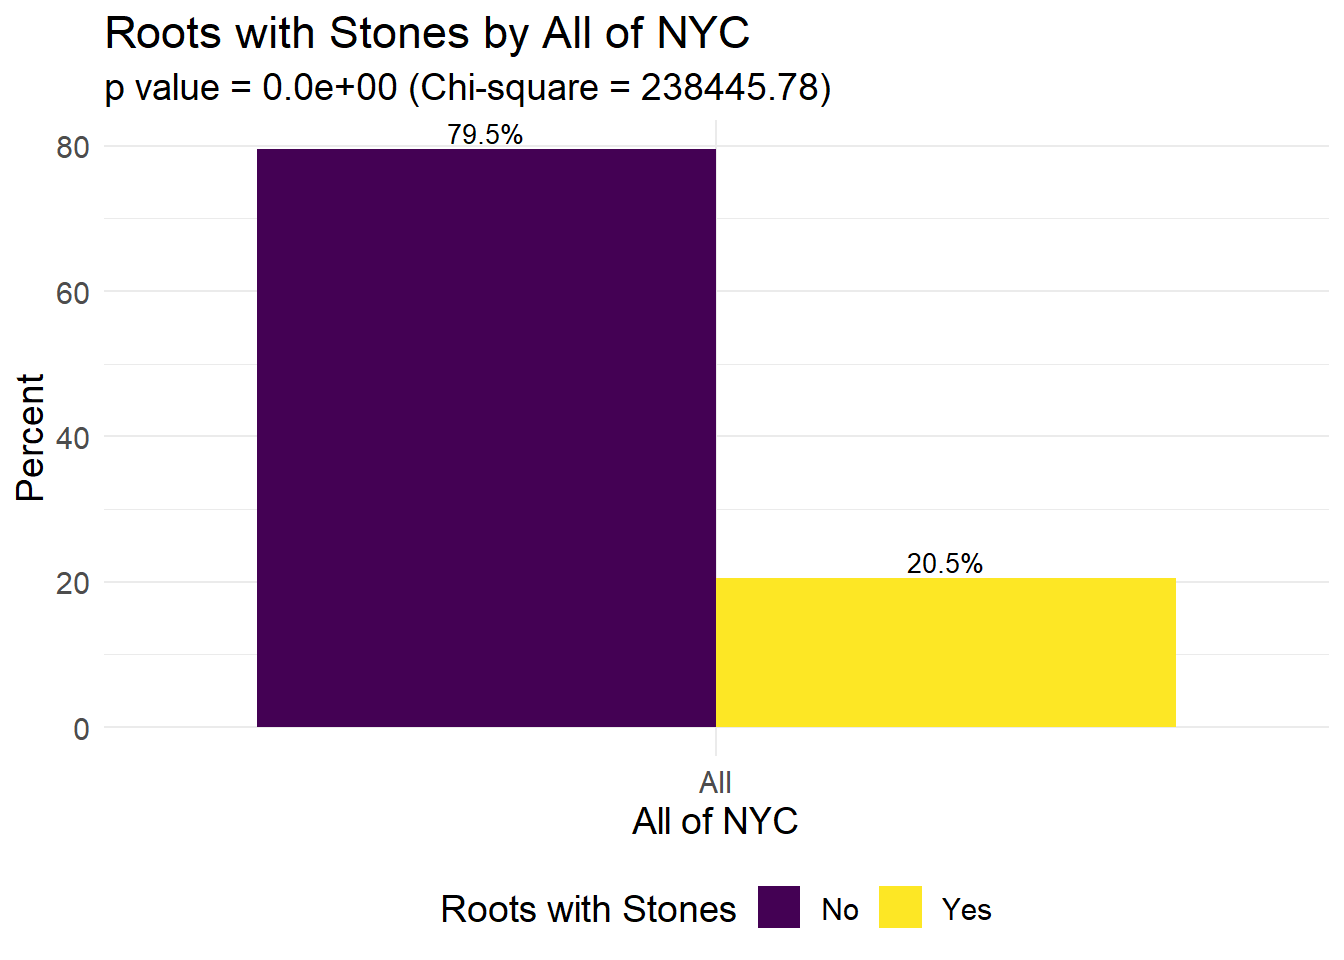
tree_attribute_plot(df = tree_status_df, exposure_str = exposure, outcome_str = "Roots in Grate")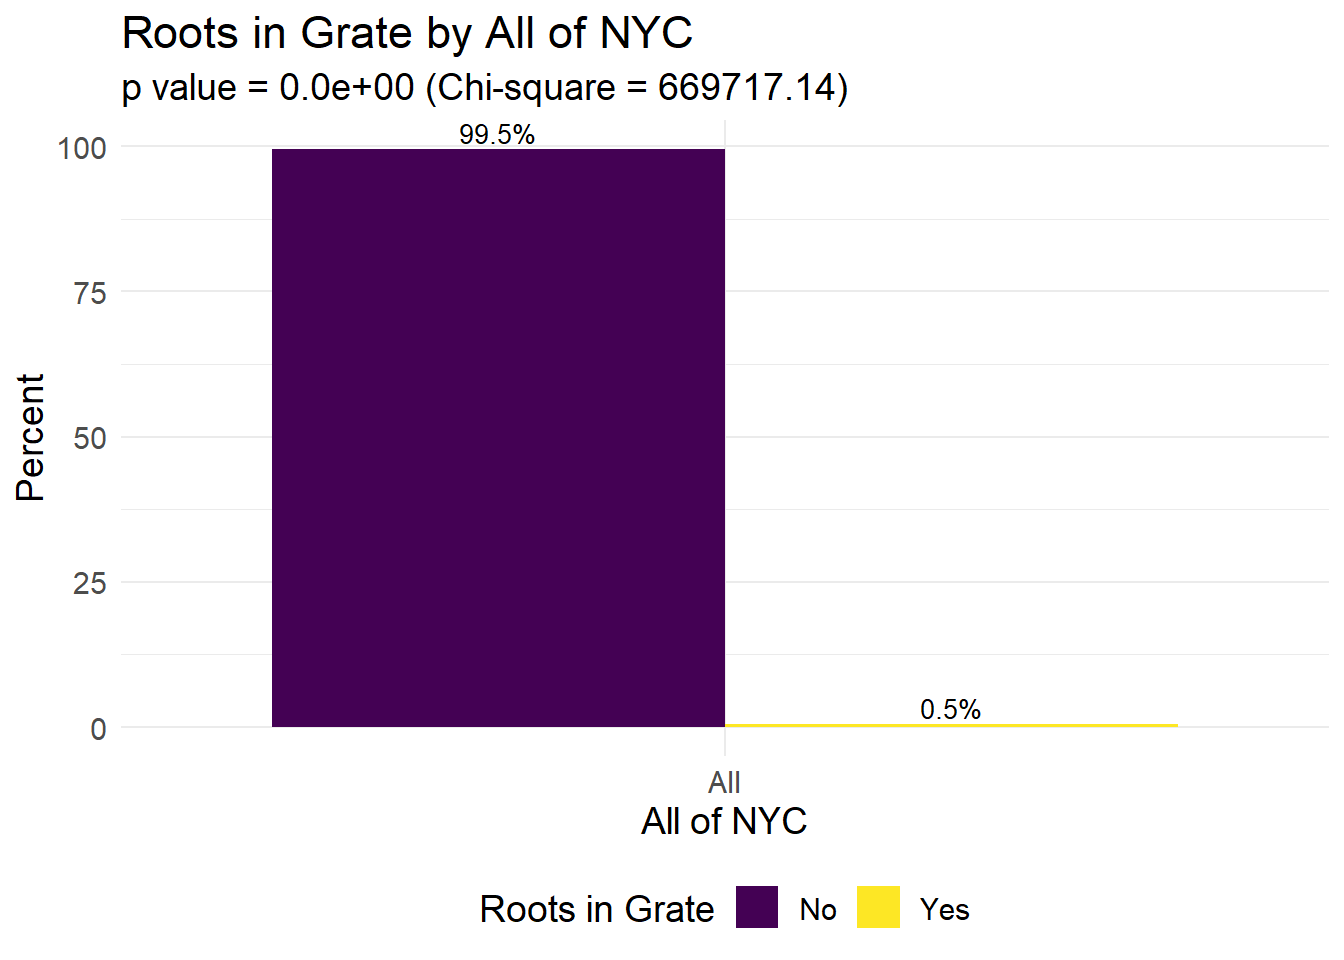
tree_attribute_plot(df = tree_status_df, exposure_str = exposure, outcome_str = "Root Problem (Other)")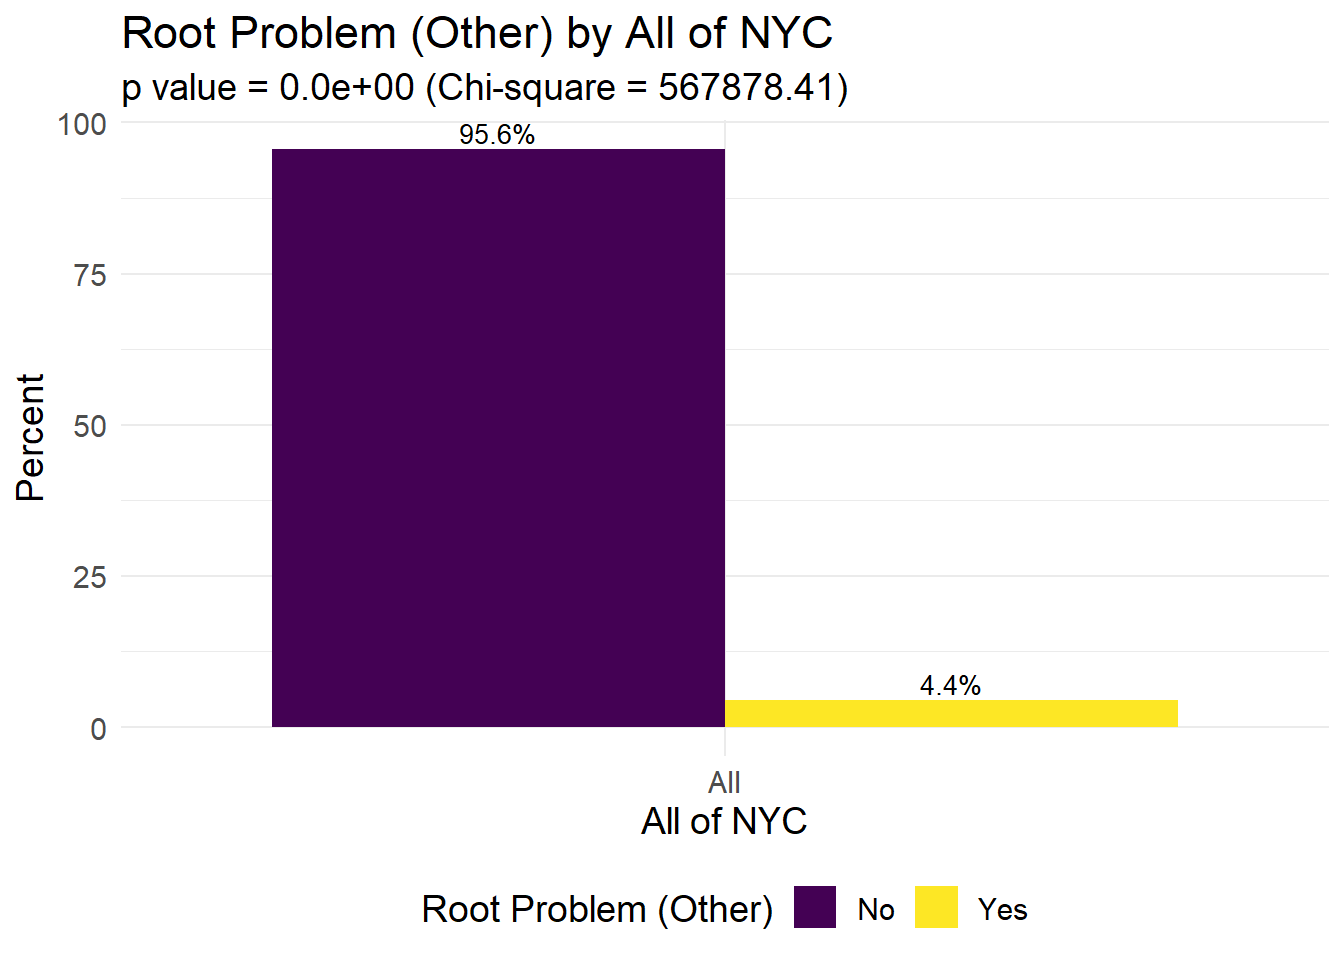
Trunk
tree_attribute_plot(df = tree_status_df, exposure_str = exposure, outcome_str = "Trunk has Wires")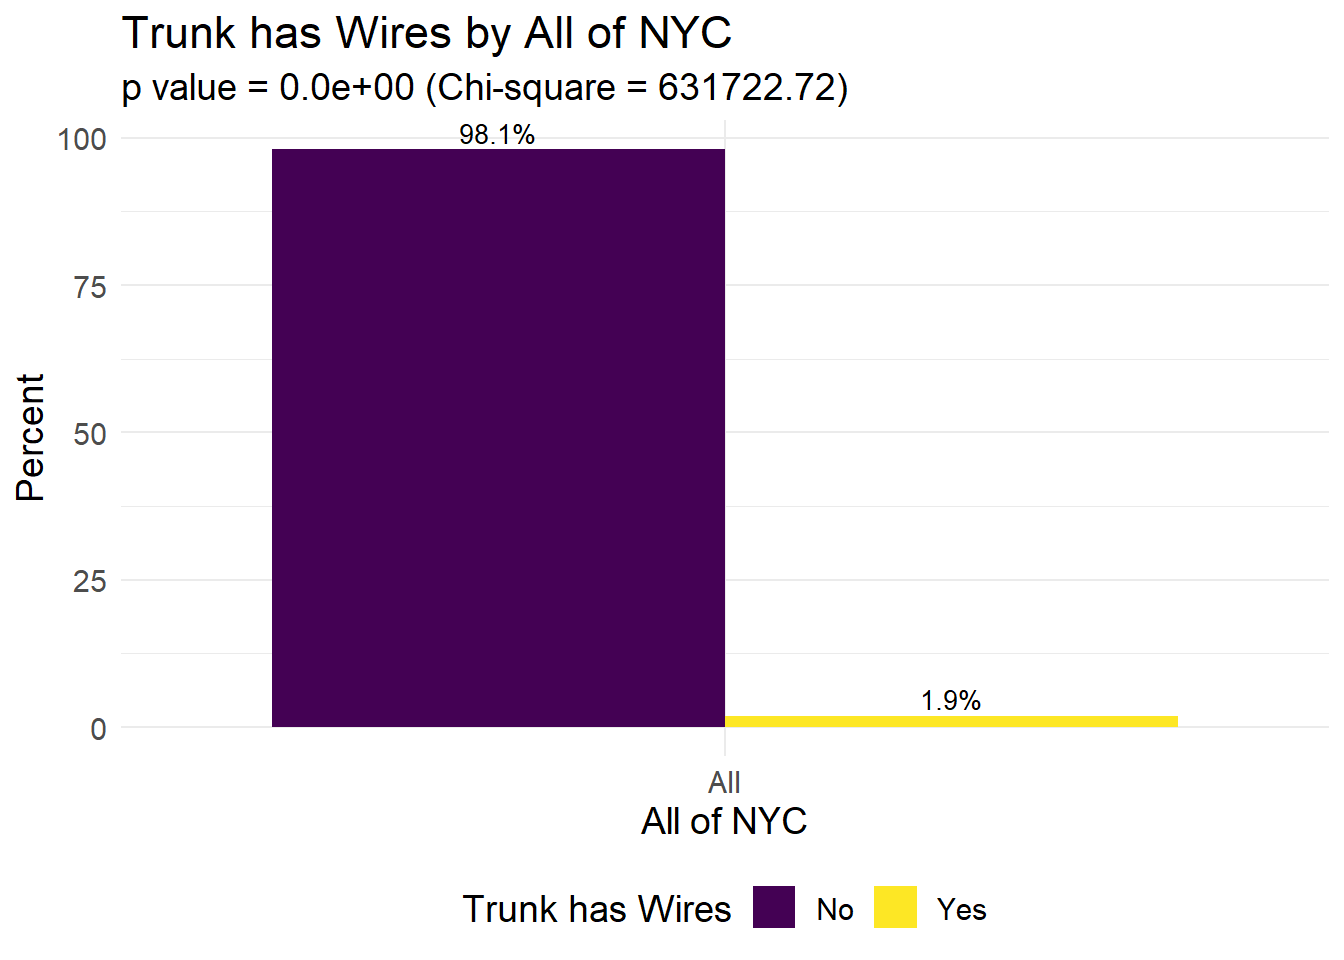
tree_attribute_plot(df = tree_status_df, exposure_str = exposure, outcome_str = "Trunk has Lights")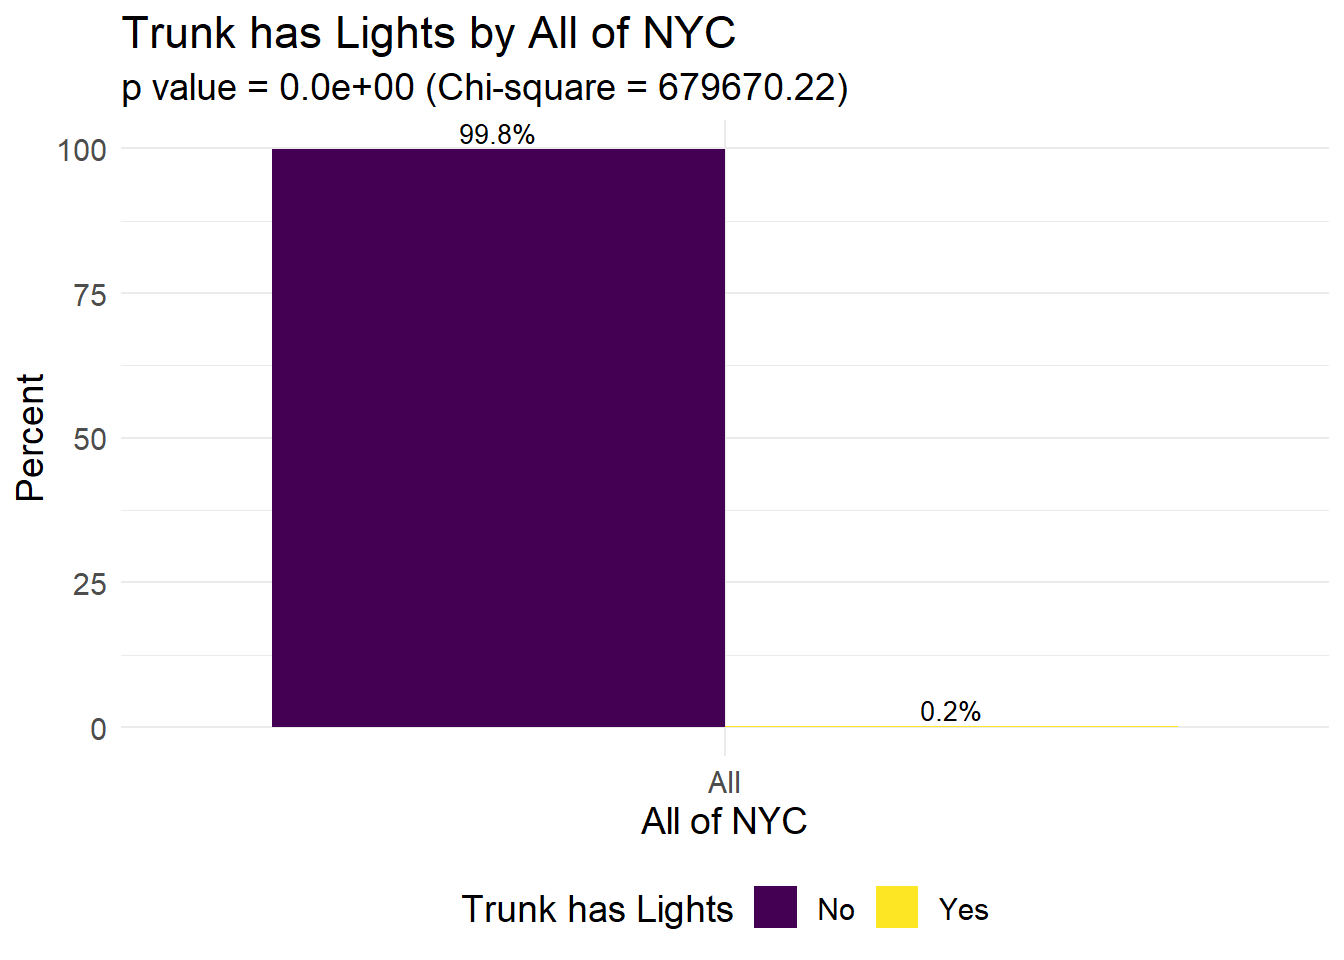
tree_attribute_plot(df = tree_status_df, exposure_str = exposure, outcome_str = "Trunk Problem (Other)")
Branches
tree_attribute_plot(df = tree_status_df, exposure_str = exposure, outcome_str = "Branches have Lights")
tree_attribute_plot(df = tree_status_df, exposure_str = exposure, outcome_str = "Branches Problem (Other)")
tree_attribute_plot(df = tree_status_df, exposure_str = exposure, outcome_str = "Branches with Shoes")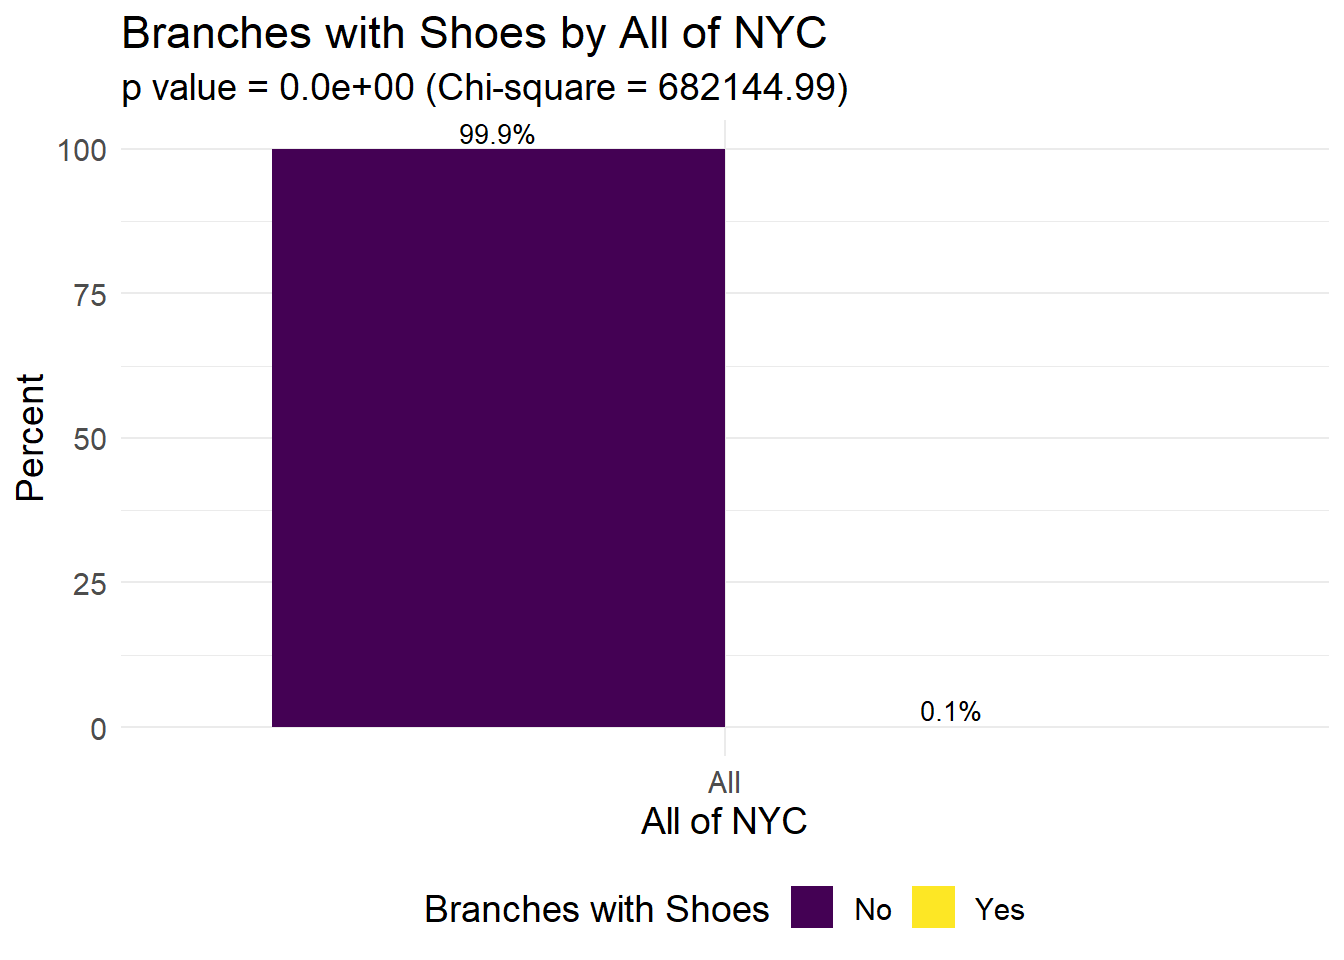
Vital Status
tree_attribute_plot(df = tree_status_df, exposure_str = exposure, outcome_str = "Alive, Dead, or Stump")
For example, we see that 81.1% of trees are in “good” health, 14.8% of trees are in “fair” health, and 4.1% of trees are in “poor” health. Notably, 28.7% of sidewalks are damaged (71.2% not damaged). The majority of trees (87.8%) do not have guards and 20.5% of tree roots have stones.
Compared to the other four boroughs, Manhattan had the lowest percentage of trees in “good” health, and the highest percentage of trees in both “fair” and “poor” health. Overall in NYC, 81.1% of trees were in “good” health, 14.8% of trees were in “fair” health, and 4.1% were in “poor” health.